Thermodynamic Database
Components (30)
Total of 30 components are included in the database as listed here:
Major alloying elements: Co, Cr, Fe, Mo, Ni, V and W.
Minor alloying elements: Al, As, B, C, Ca, Ce, Cu, Mg, Mn, N, Nb, O, P, Pb, Pr, S, Si, Sn, Ta, Ti, Y, Zn and Zr.
Suggested Composition Range
The suggested composition range for each element is listed in Table 1. It should be noted that this given composition range is rather conservative. It is derived from the chemistries of the multicomponent commercial alloys that have been used to validate the current database. In the subsystems, many of these elements can be applied to a much wider composition range. In fact, some subsystems are valid in the entire composition range as given in Section Assessed Subsystems.
Phases
Total of 704 phases are included in the current database. The names and thermodynamic models of some phases are given in Table 2. Information on all the other phases is listed in PanCo2024:List of All Phases. Users can also view it through TDB viewer of Pandat™ .
Assessed Subsystems
A total of 351 subsystems, including 317 binary, 32 ternary and 2 quaternary subsystems have been assessed. The modeling status is indicated by numbers. The systems with number 10 are fully assessed in the whole composition range. The higher value shows higher reliability of the system:
Binary Systems (317)
| Al-As(10) | Al-B(10) | Al-C(10) | Al-Ca(10) | Al-Ce(10) | Al-Co(10) |
| Al-Cr(10) | Al-Cu(10) | Al-Fe(10) | Al-Mg(10) | Al-Mn(10) | Al-Mo(10) |
| Al-N(10) | Al-Nb(10) | Al-Ni(10) | Al-P(10) | Al-Pb(10) | Al-S(10) |
| Al-Si(10) | Al-Sn(10) | Al-Ta(10) | Al-Ti(10) | Al-V(10) | Al-W(10) |
| Al-Y(10) | Al-Zn(10) | Al-Zr(10) | As-Co(10) | As-Cu(10) | As-Fe(10) |
| As-Mn(10) | As-Ni(10) | As-Pb(10) | B-C(10) | B-Ca(10) | B-Ce(10) |
| B-Co(10) | B-Cr(10) | B-Fe(10) | B-Mg(10) | B-Mn(10) | B-Mo(10) |
| B-Nb(10) | B-Ni(10) | B-Pr(10) | B-Si(10) | B-Ta(10) | B-Ti(10) |
| B-V(10) | B-W(10) | B-Zr(10) | C-Ce(10) | C-Co(10) | C-Cr(10) |
| C-Fe(10) | C-Mg(10) | C-Mn(10) | C-Mo(10) | C-Nb(10) | C-Ni(10) |
| C-Pr(10) | C-Si(10) | C-Ta(10) | C-Ti(10) | C-V(10) | C-W(10) |
| C-Zr(10) | Ca-Ce(10) | Ca-Cu(10) | Ca-Fe(10) | Ca-Mg(10) | Ca-Mn(10) |
| Ca-Mo(10) | Ca-Ni(10) | Ca-Pb(10) | Ca-S(10) | Ca-Si(10) | Ca-Sn(10) |
| Ca-Ti(10) | Ca-V(10) | Ca-Zn(10) | Ce-Co(10) | Ce-Cr(10) | Ce-Cu(10) |
| Ce-Fe(10) | Ce-Mg(10) | Ce-Mn(10) | Ce-Mo(10) | Ce-Ni(10) | Ce-Si(10) |
| Ce-Sn(10) | Ce-Ti(10) | Ce-V(10) | Ce-Y(10) | Ce-Zn(10) | Ce-Zr(10) |
| Co-Cr(10) | Co-Cu(10) | Co-Fe(10) | Co-Mg(10) | Co-Mn(10) | Co-Mo(10) |
| Co-N(10) | Co-Nb(10) | Co-Ni(10) | Co-P(10) | Co-Pb(10) | Co-Si(10) |
| Co-Sn(10) | Co-Ta(10) | Co-Ti(10) | Co-V(10) | Co-W(10) | Co-Y(10) |
| Co-Zn(10) | Co-Zr(10) | Cr-Cu(10) | Cr-Fe(10) | Cr-Mg(10) | Cr-Mn(10) |
| Cr-Mo(10) | Cr-N(10) | Cr-Nb(10) | Cr-Ni(10) | Cr-P(10) | Cr-Pb(10) |
| Cr-S(10) | Cr-Si(10) | Cr-Sn(10) | Cr-Ta(10) | Cr-Ti(10) | Cr-V(10) |
| Cr-W(10) | Cr-Y(10) | Cr-Zn(10) | Cr-Zr(10) | Cu-Fe(10) | Cu-Mg(10) |
| Cu-Mn(10) | Cu-Mo(10) | Cu-N(10) | Cu-Nb(10) | Cu-Ni(10) | Cu-P(10) |
| Cu-Pb(10) | Cu-Pr(10) | Cu-S(10) | Cu-Si(10) | Cu-Sn(10) | Cu-Ta(10) |
| Cu-Ti(10) | Cu-V(10) | Cu-W(10) | Cu-Y(10) | Cu-Zn(10) | Cu-Zr(10) |
| Fe-Mg(10) | Fe-Mn(10) | Fe-Mo(10) | Fe-N(10) | Fe-Nb(10) | Fe-Ni(10) |
| Fe-P(10) | Fe-Pb(10) | Fe-S(10) | Fe-Si(10) | Fe-Sn(10) | Fe-Ta(10) |
| Fe-Ti(10) | Fe-V(10) | Fe-W(10) | Fe-Y(10) | Fe-Zn(10) | Fe-Zr(10) |
| Mg-Mn(10) | Mg-Mo(10) | Mg-N(10) | Mg-Nb(10) | Mg-Ni(10) | Mg-Pb(10) |
| Mg-Pr(10) | Mg-S(10) | Mg-Si(10) | Mg-Sn(10) | Mg-Ti(10) | Mg-V(10) |
| Mg-Y(10) | Mg-Zn(10) | Mg-Zr(10) | Mn-Mo(10) | Mn-N(10) | Mn-Nb(10) |
| Mn-Ni(10) | Mn-P(10) | Mn-Pb(10) | Mn-Pr(10) | Mn-S(10) | Mn-Si(10) |
| Mn-Sn(10) | Mn-Ta(10) | Mn-Ti(10) | Mn-V(10) | Mn-W(10) | Mn-Y(10) |
| Mn-Zn(10) | Mn-Zr(10) | Mo-N(10) | Mo-Nb(10) | Mo-Ni(10) | Mo-P(10) |
| Mo-Pb(10) | Mo-S(10) | Mo-Si(10) | Mo-Sn(10) | Mo-Ta(10) | Mo-Ti(10) |
| Mo-V(10) | Mo-Y(10) | Mo-Zr(10) | N-Nb(10) | N-Ni(10) | N-Si(10) |
| N-Ta(10) | N-Ti(10) | N-V(10) | N-W(10) | N-Zr(10) | Nb-Ni(10) |
| Nb-P(10) | Nb-Si(10) | Nb-Sn(10) | Nb-Ta(10) | Nb-Ti(10) | Nb-V(10) |
| Nb-W(10) | Nb-Y(10) | Nb-Zr(10) | Ni-P(10) | Ni-Pb(10) | Ni-Pr(10) |
| Ni-S(10) | Ni-Si(10) | Ni-Sn(10) | Ni-Ta(10) | Ni-Ti(10) | Ni-V(10) |
| Ni-W(10) | Ni-Y(10) | Ni-Zn(10) | Ni-Zr(10) | P-Si(10) | P-Ti(10) |
| Pb-Si(10) | Pb-Sn(10) | Pb-Zn(10) | Pb-Zr(10) | Pr-Y(10) | Pr-Zn(10) |
| S-Ti(10) | Si-Sn(10) | Si-Ta(10) | Si-Ti(10) | Si-V(10) | Si-W(10) |
| Si-Y(10) | Si-Zn(10) | Si-Zr(10) | Sn-Ti(10) | Sn-V(10) | Sn-Y(10) |
| Sn-Zn(10) | Sn-Zr(10) | Ta-Ti(10) | Ta-V(10) | Ta-W(10) | Ta-Zr(10) |
| Ti-V(10) | Ti-W(10) | Ti-Zr(10) | V-W(10) | V-Y(10) | V-Zn(10) |
| V-Zr(10) | W-Y(10) | W-Zr(10) | Y-Zn(10) | Y-Zr(10) | Zn-Zr(10) |
| Al-O(10) | B-O(10) | C-O(10) | Ca-O(10) | Ce-O(10) | Co-O(10) |
| Cr-O(10) | Cu-O(10) | Fe-O(10) | Mg-O(10) | Mn-O(10) | Mo-O(10) |
| Nb-O(10) | Ni-O(10) | O-P(10) | O-Pb(10) | O-S(10) | O-Si(10) |
| O-Sn(10) | O-Ta(10) | O-Ti(10) | O-V(10) | O-W(10) | O-Y(10) |
| O-Zr(10) | O-Pr(9) | B-Cu(8) | B-N(5) | O-Zn(5) |
Ternary Systems (32)
| Al-C-Fe(10) | B-Co-Fe(10) | B-Cr-Fe(10) | B-Fe-Mo(10) | B-Fe-Ni(10) | B-Fe-Si(10) |
| C-Co-Fe(10) | C-Cr-Fe(10) | C-Cr-Mn(10) | C-Fe-Mn(10) | C-Fe-Mo(10) | C-Fe-Ni(10) |
| C-Fe-Si(10) | C-Fe-W(10) | Co-Fe-Ni(10) | Co-Fe-W(10) | Cr-Fe-Mn(10) | Cr-Fe-Mo(10) |
| Cr-Fe-Ni(10) | Cr-Fe-W(10) | Cr-Fe-N(10) | Cr-Fe-P(10) | Fe-Mn-Ni(10) | Fe-Mn-W(10) |
| Fe-Mn-P(10) | Fe-Mo-Ni(10) | Fe-Mo-W(10) | Fe-Mo-P(10) | Fe-Ni-P(10) | Fe-Ni-S(10) |
| Co-Cr-Fe(8) | Co-Fe-Mo(8) |
Quaternary Systems (2)
| C-Cr-Fe-Mn(10) | Al-C-Fe-Mn(10) |
Database Validation
The current thermodynamic database for iron-based alloy systems has been extensively tested and validated using the published experimental data. This database can be used to calculate phase equilibria for multi-component iron alloys, such as the equilibrium between Bcc (ferrite) and Fcc (austenite). It can be used to predict phase transformation temperatures, such as liquidus, solidus, and so on. The fraction of each phase as a function of temperature, partitioning of components in different phases can also be calculated. In addition to equilibrium calculations, Scheil simulations can also be carried out using this database.
Some validation results are presented below.
Figure 1 and Figure 2 show comparison between the calculated and experimentally measured liquidus and solidus temperatures for variety of steels. Figure 3 shows comparison between the calculated and experimentally observed amounts of austenite in duplex stainless steels. Figure 4 is a comparison between the calculated and experimentally measured partitioning of Fe, Cr, Mo, and Ni in ferrite and austenite. Figure 5 ~ Figure 9 are comparisons between the calculated and experimentally observed equilibrium compositions for Fe, C, Co, Cr, Mo, Si, V and W in austenite, ferrite, M6C, MC and M2C at 1200 °C, respectively. These figures show reasonable agreement between the calculated values using the current PanFe database and the experimental determined ones.
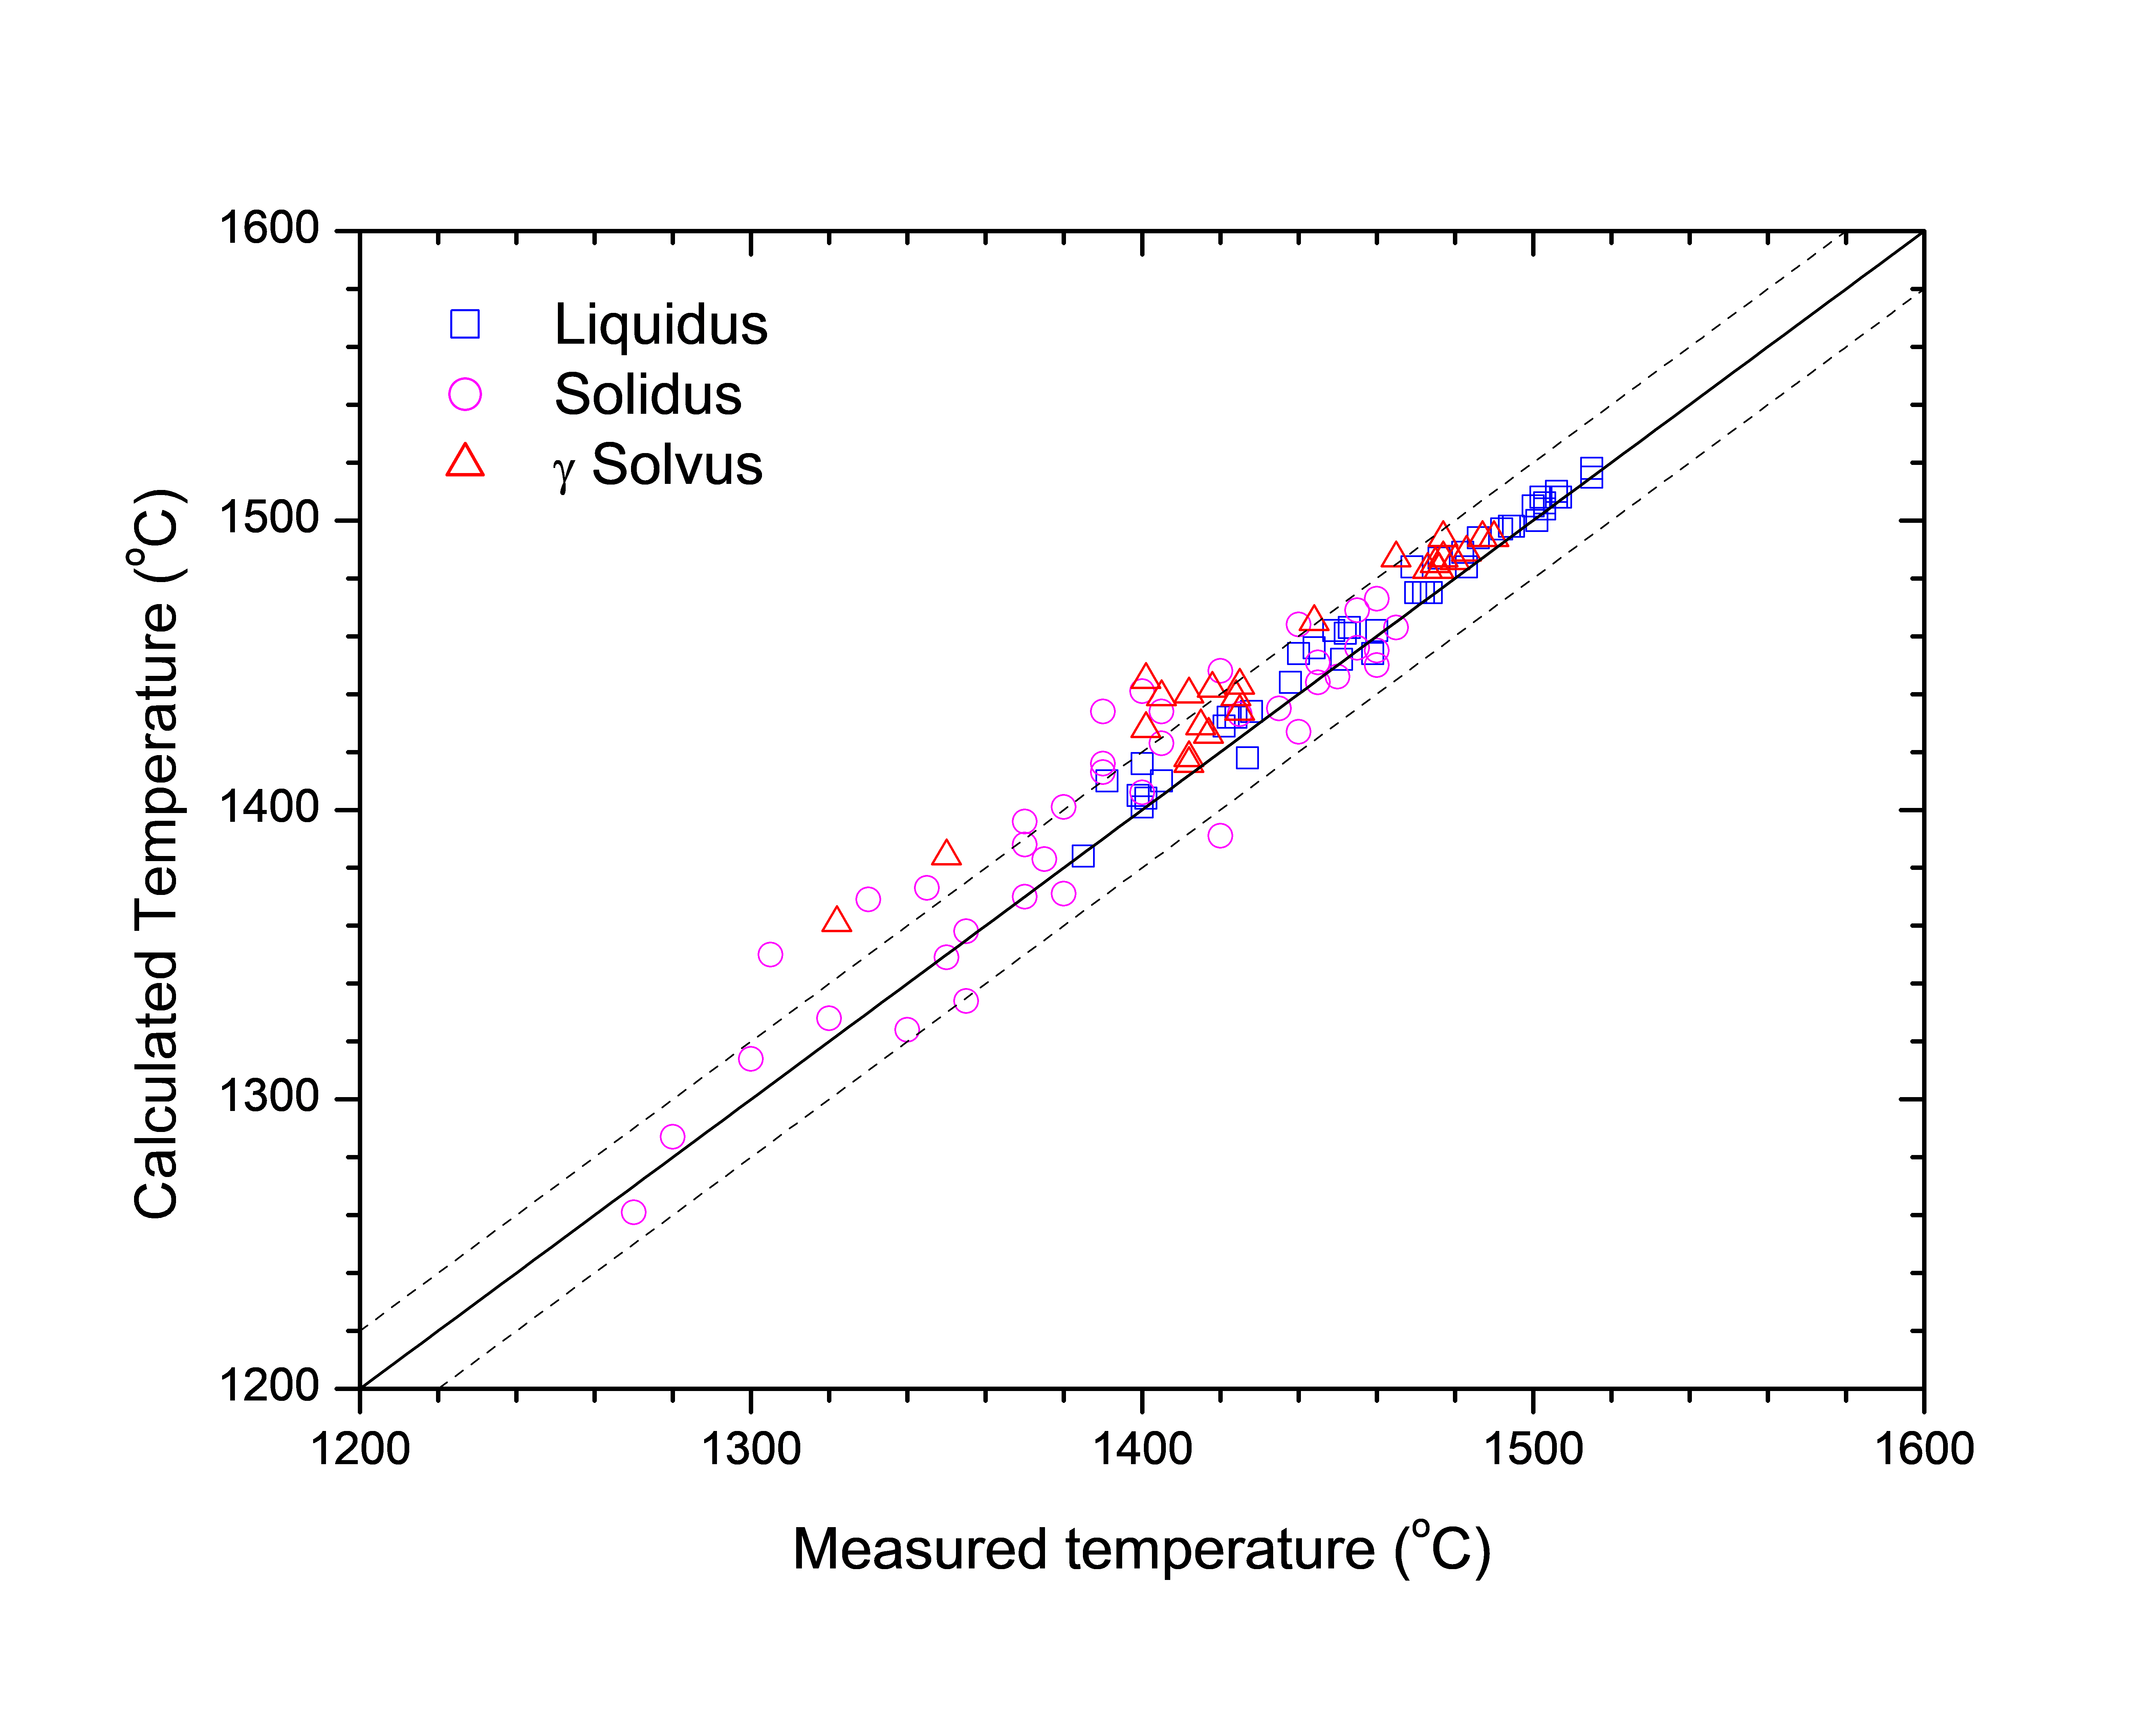
Figure 1: Comparison between the calculated liquidus and solidus temperatures for iron-based alloys with experimental data from [1977Jer]
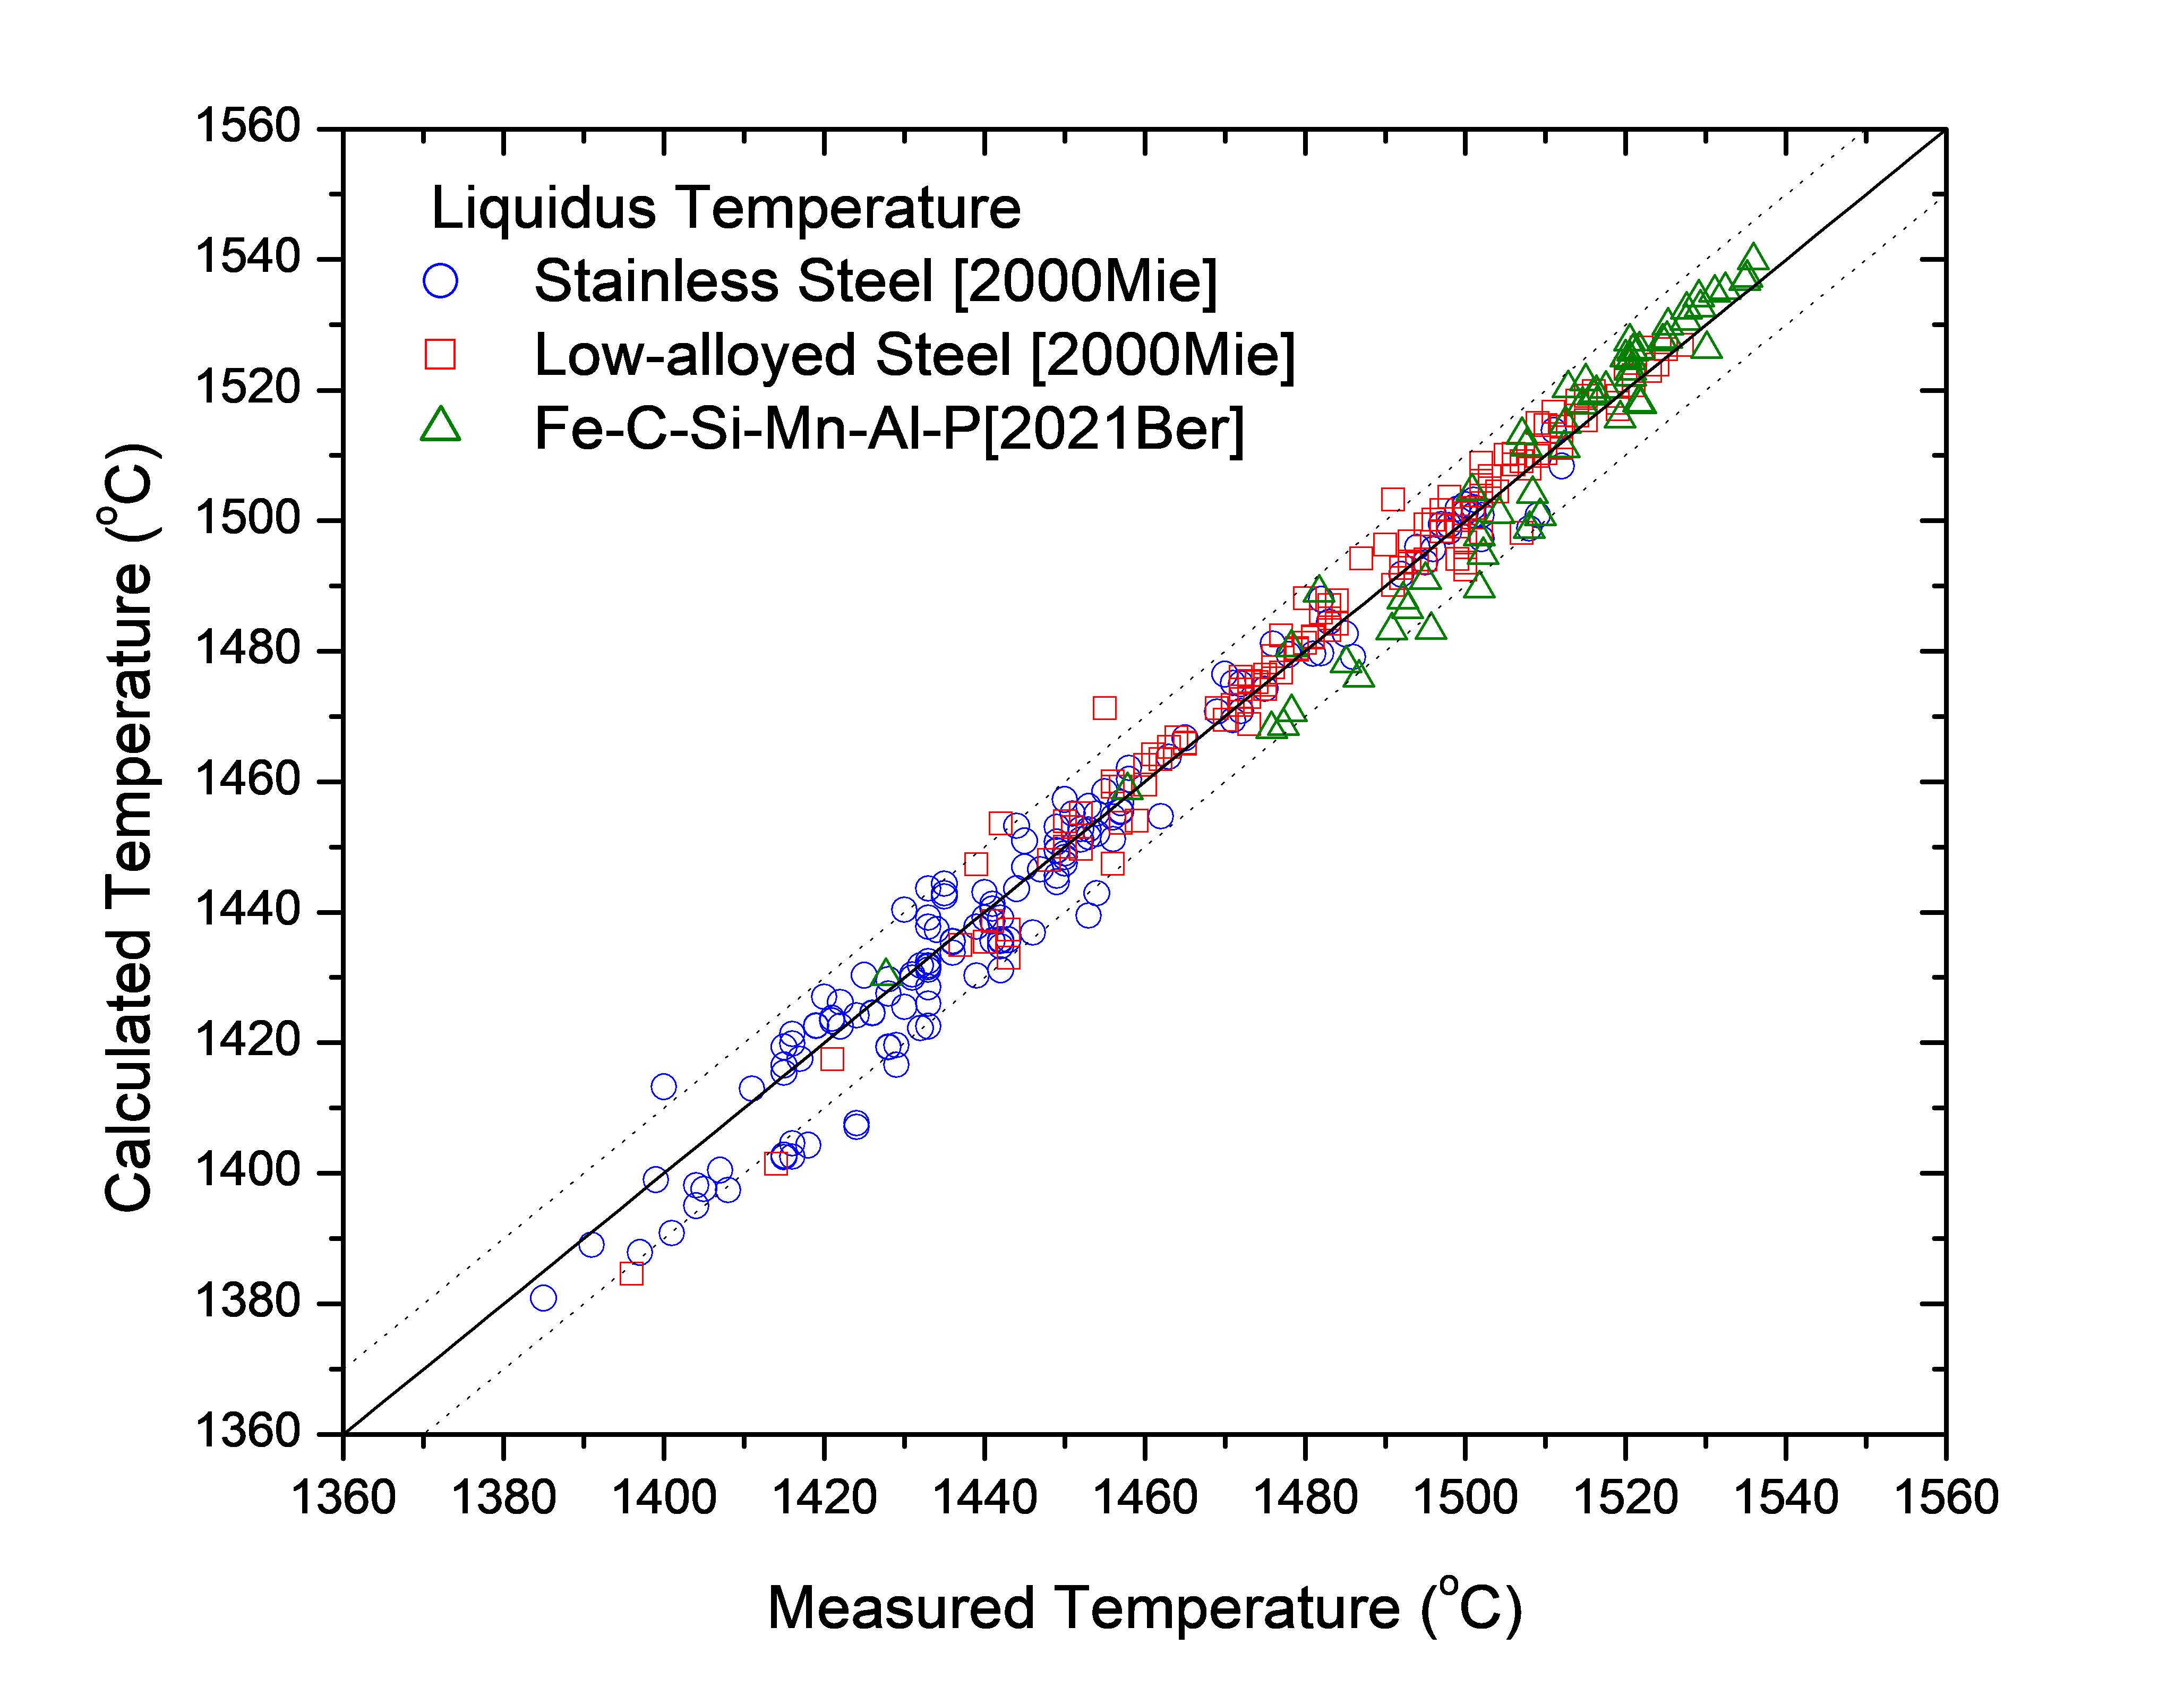
Figure 2: Comparison between the calculated liquidus temperatures for iron-based alloys with experimental data from [2000Mie,2021Ber]
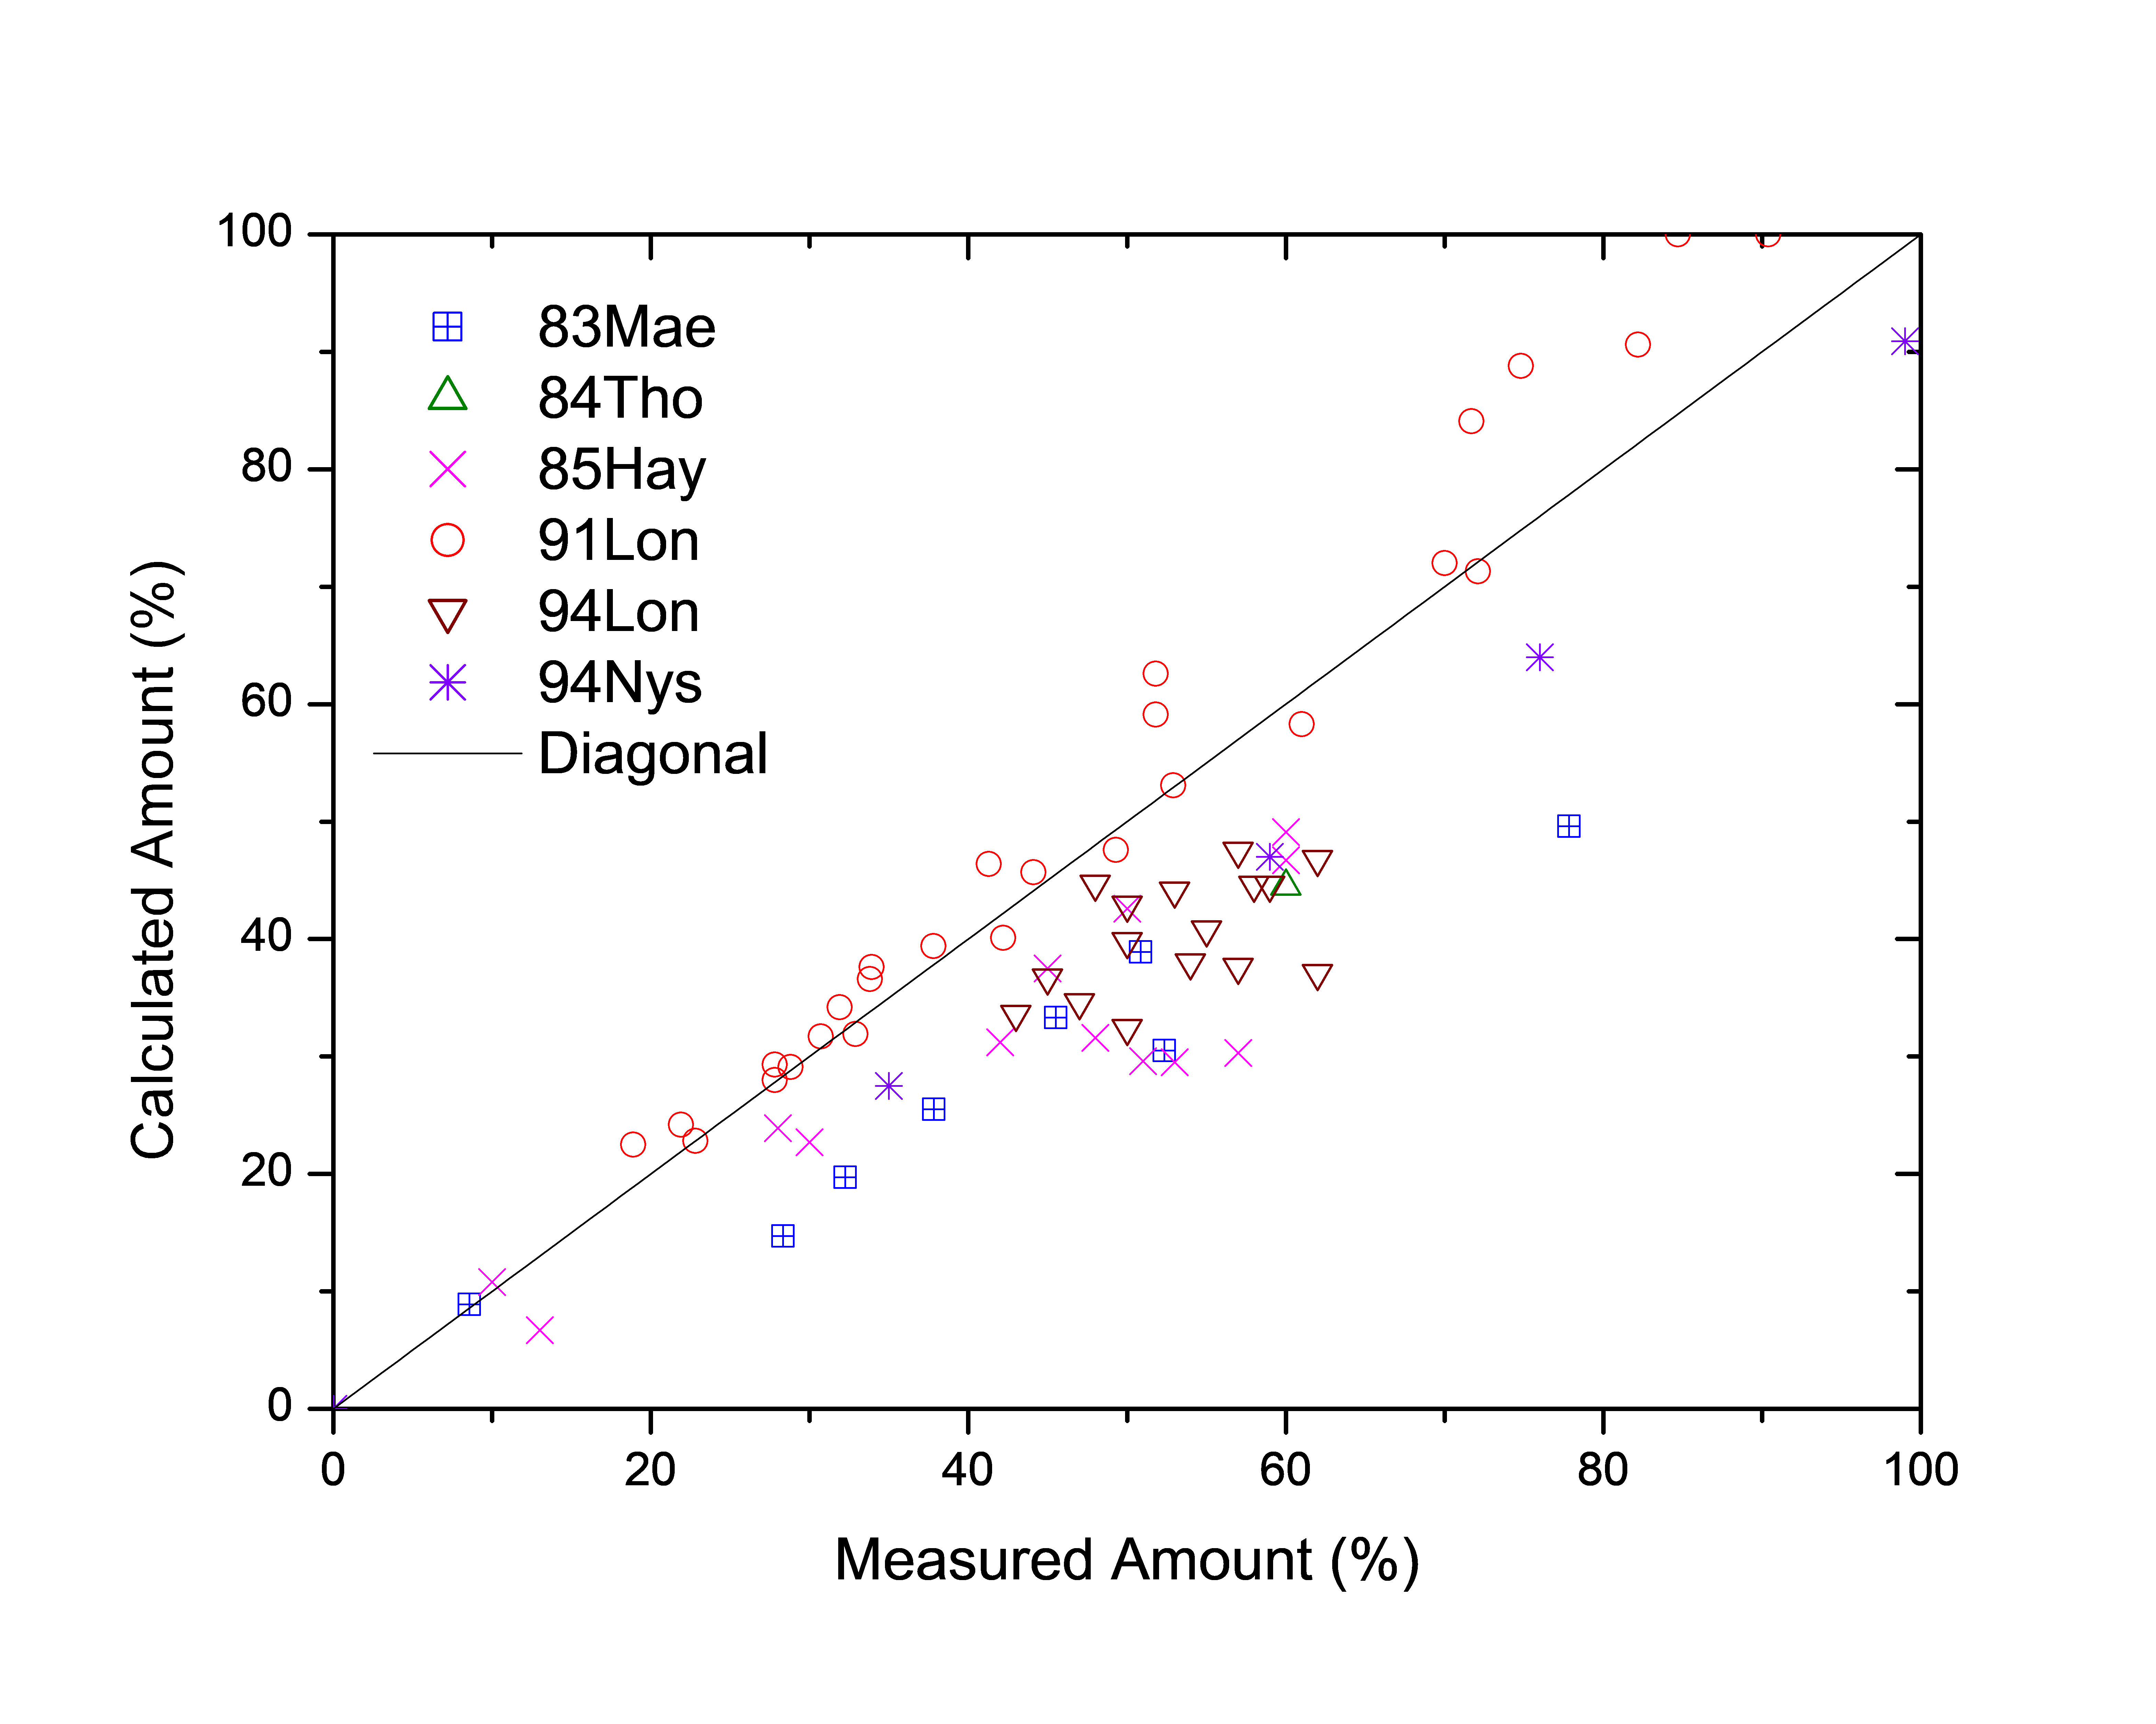
Figure 3: Comparison between the calculated and experimentally measured amounts of austenite in duplex stainless steels of austenite (Fcc)
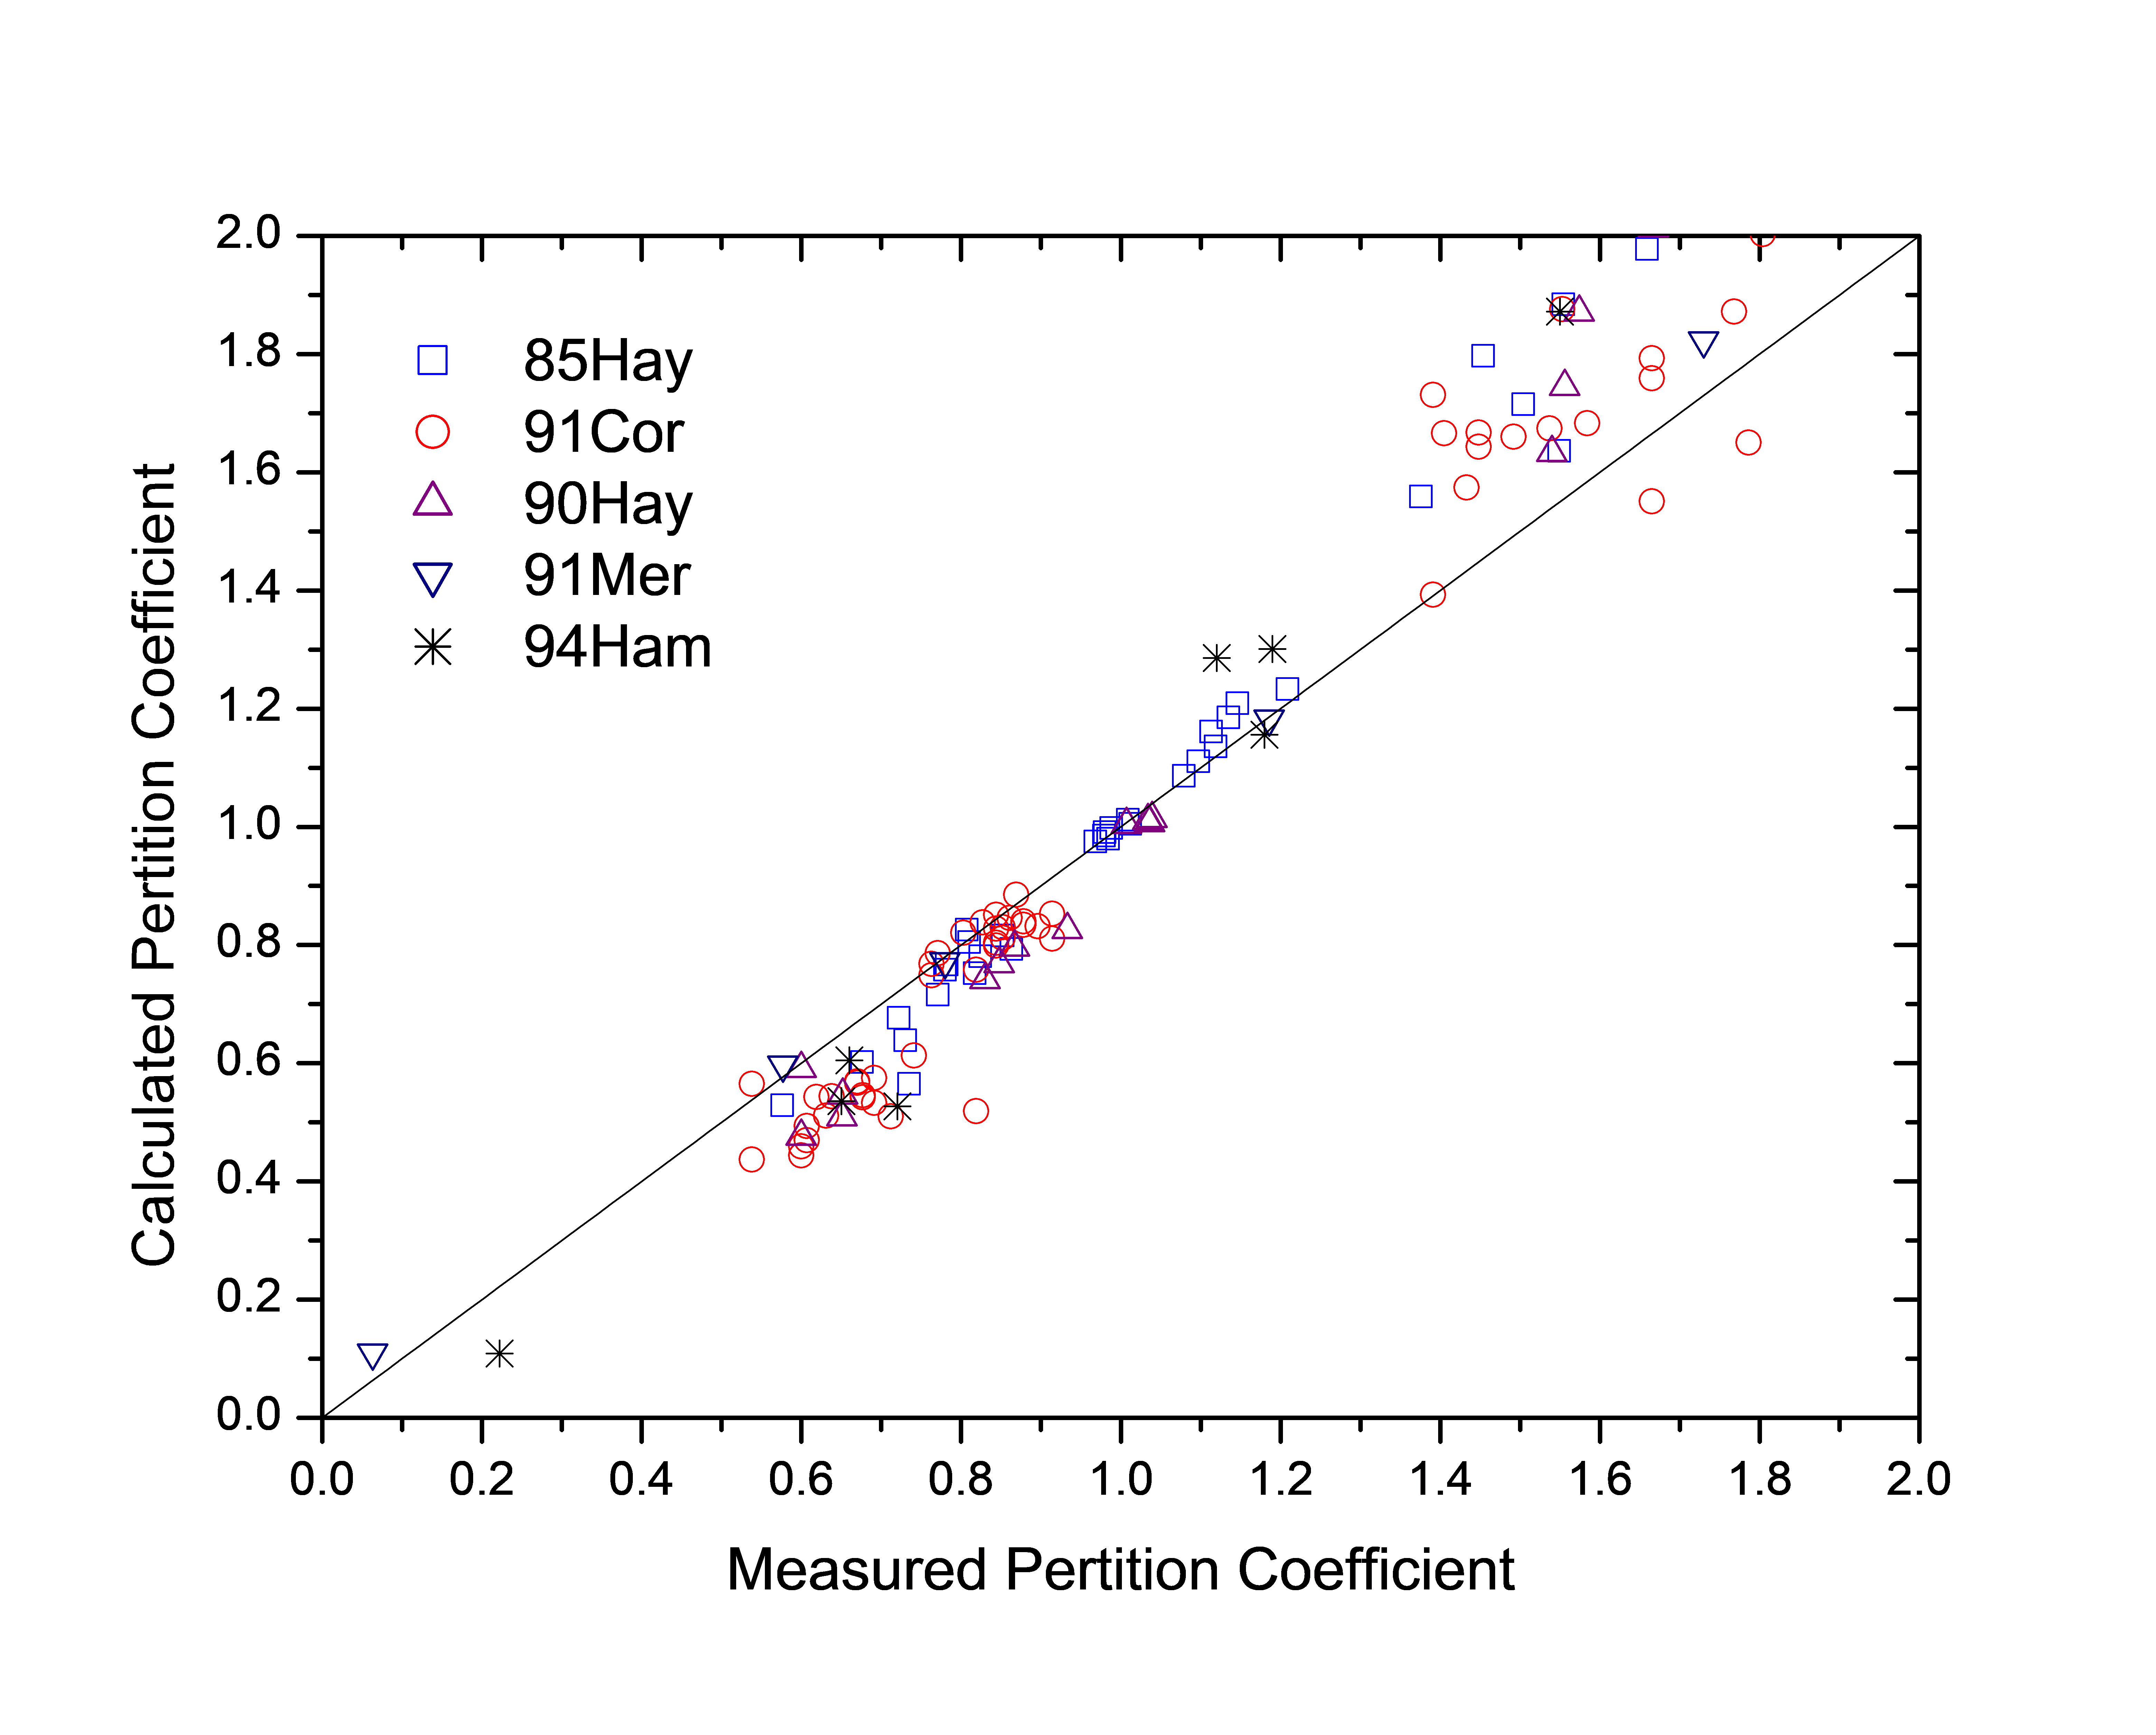
Figure 4: Comparison between the calculated and experimentally measured partitioning of Fe, Cr, Mo and Ni in ferrite and austenite
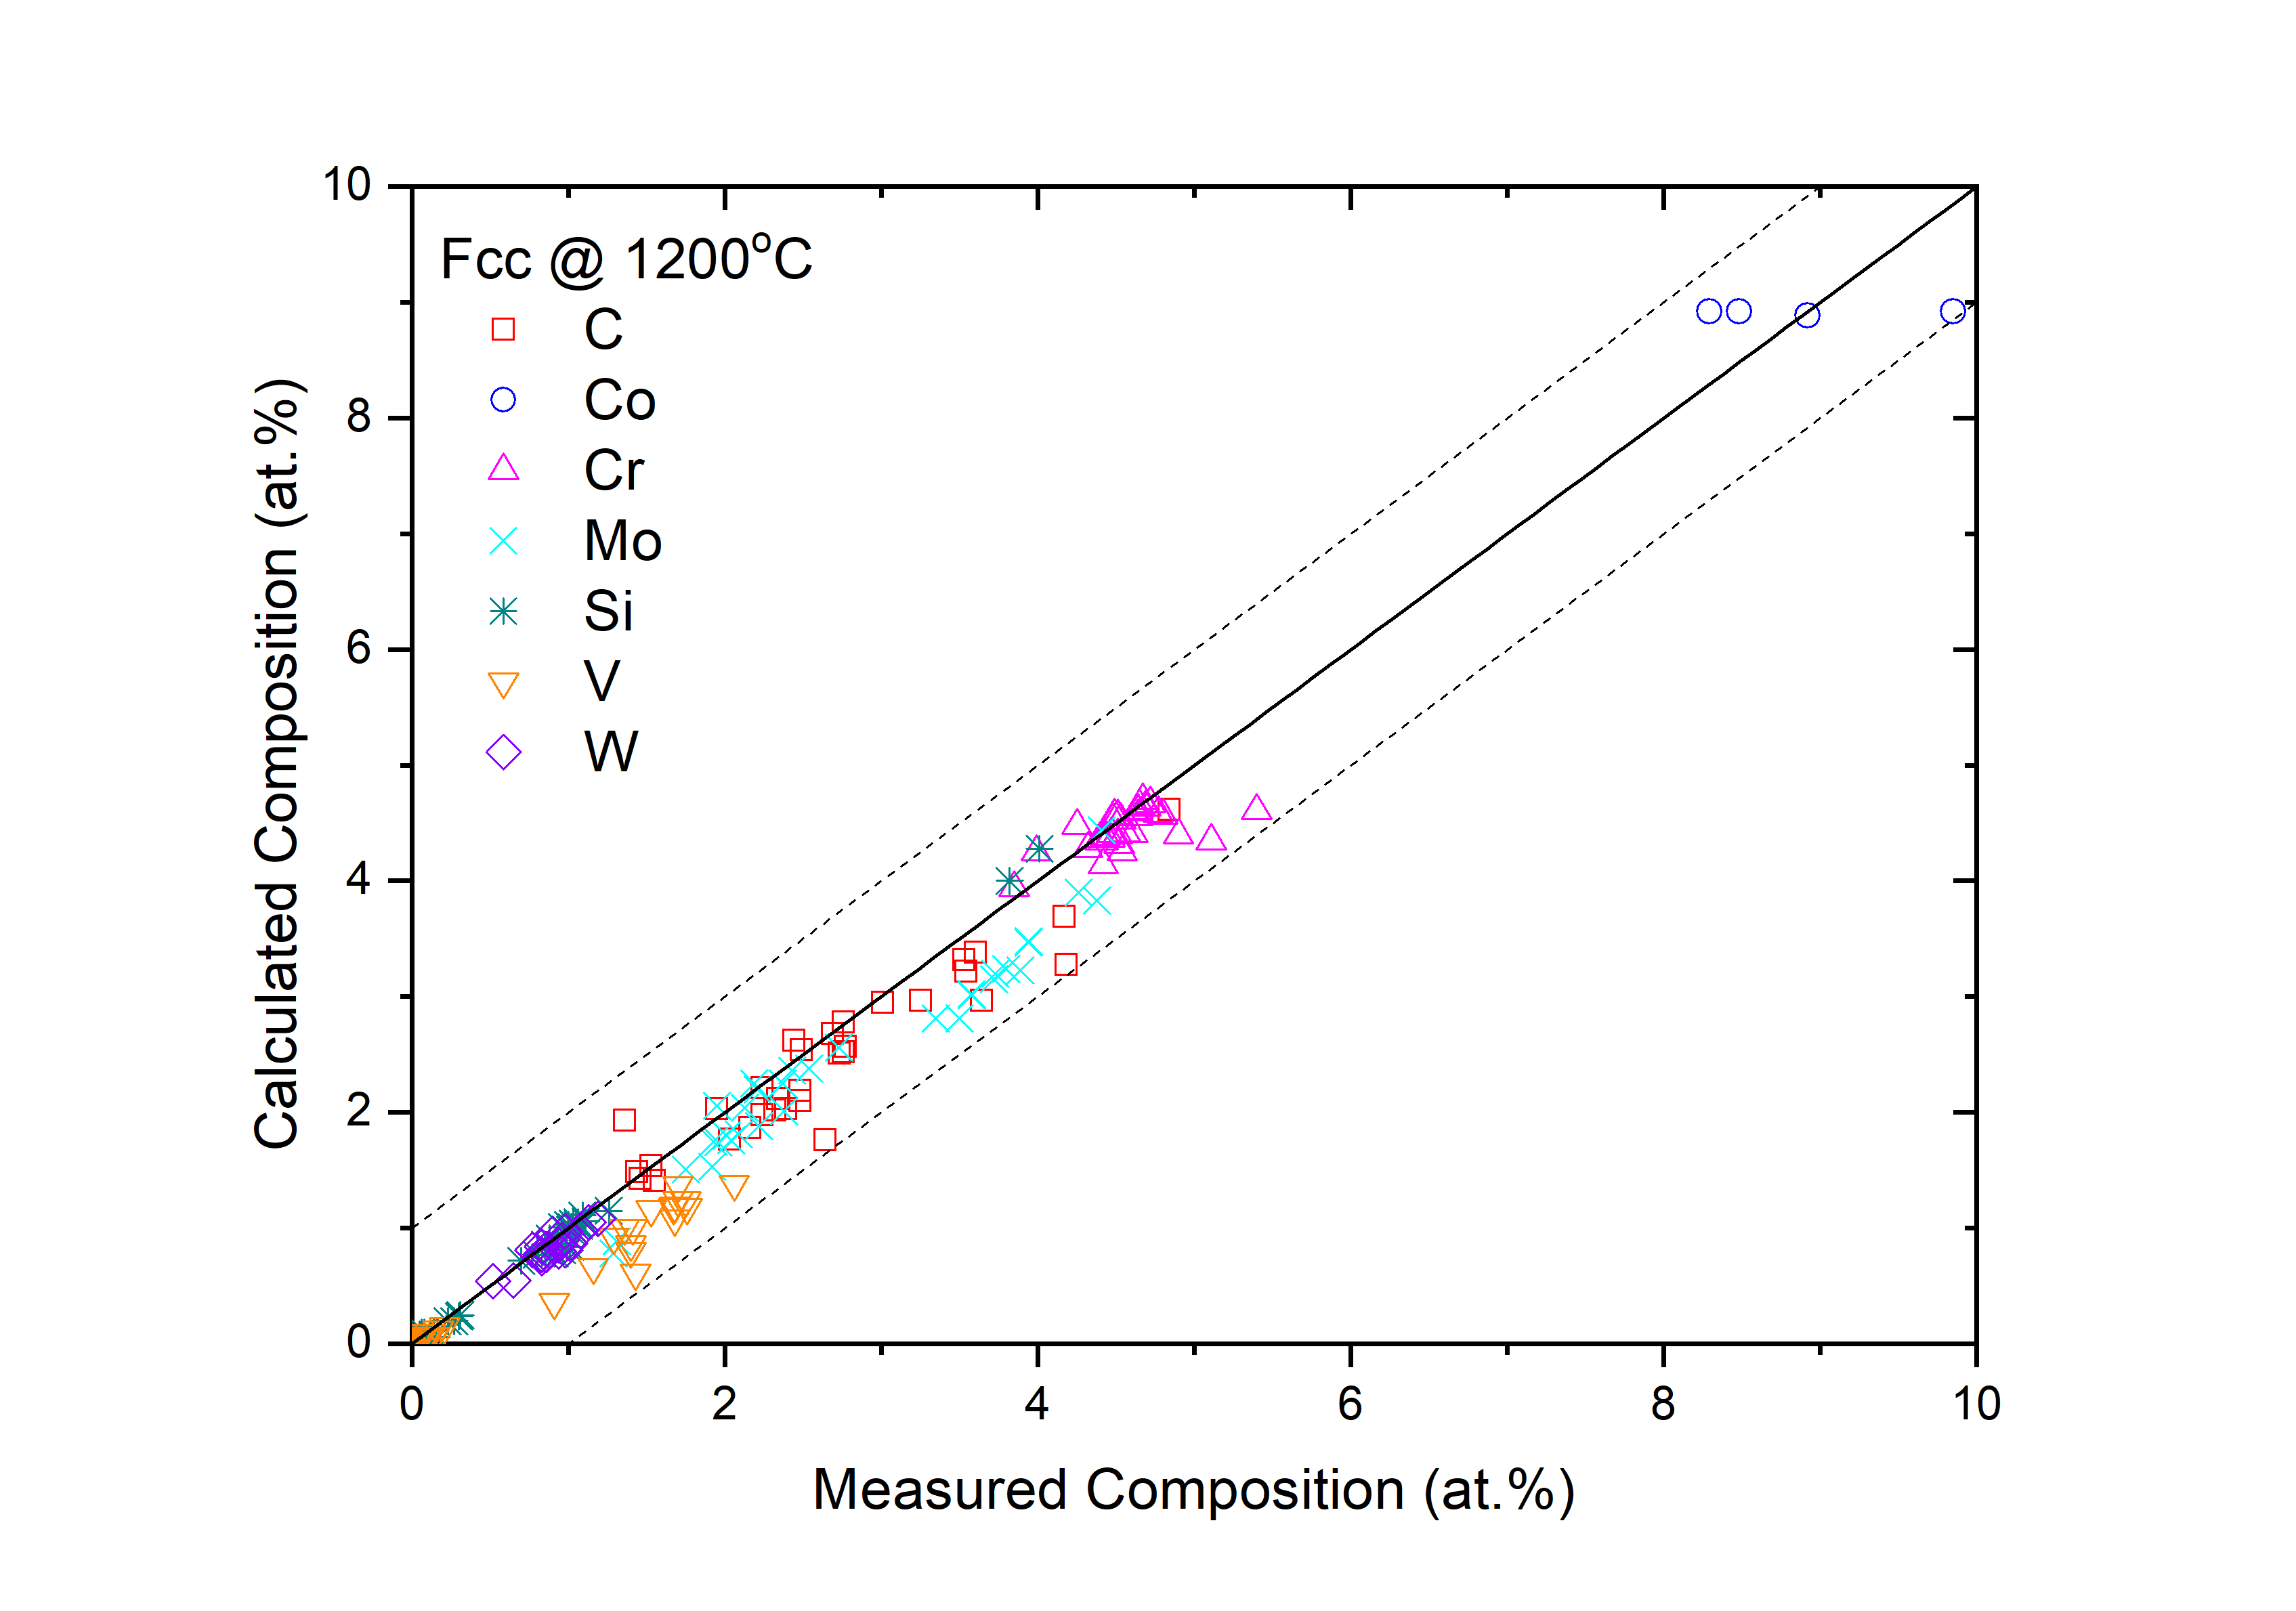
Figure 5: Comparison between the calculated and measured equilibrium compositions of C, Co, Cr, Mo, Si, V and W in the Fcc phase at 1200 °C
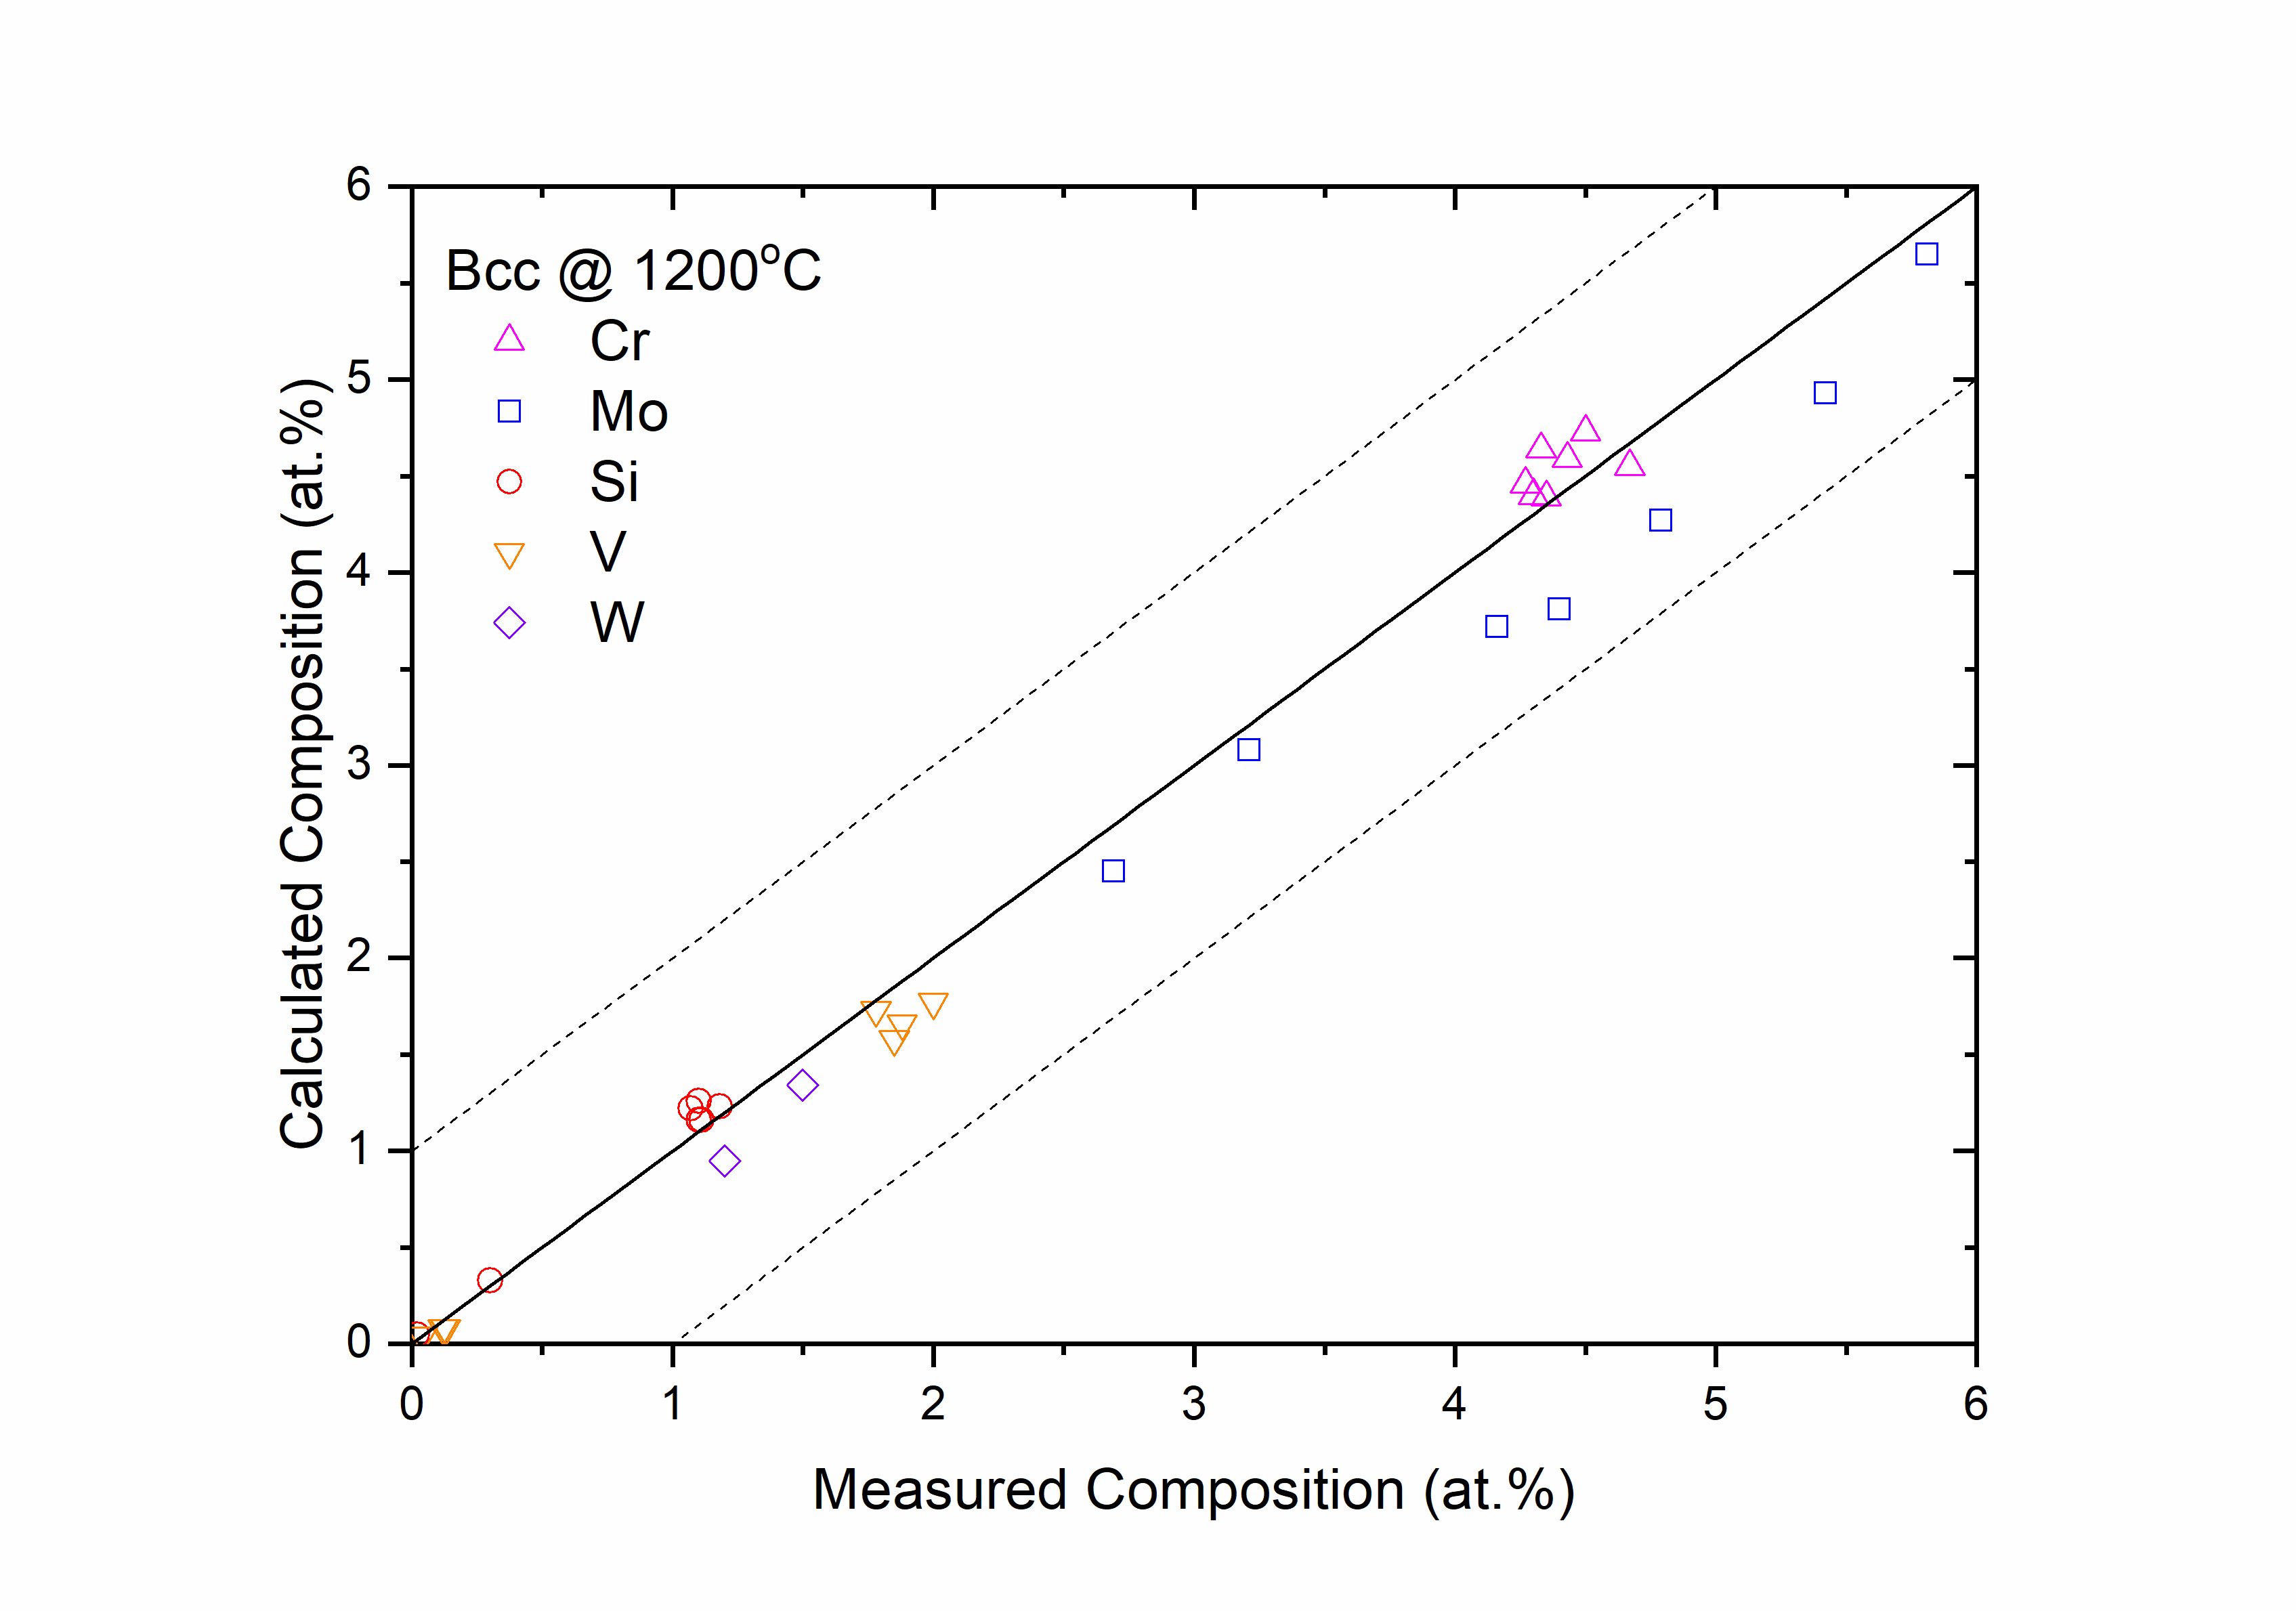
Figure 6: Comparison between the calculated and measured equilibrium compositions of Cr, Mo, Si, V and W in the Bcc (ferrite) phase at 1200 °C
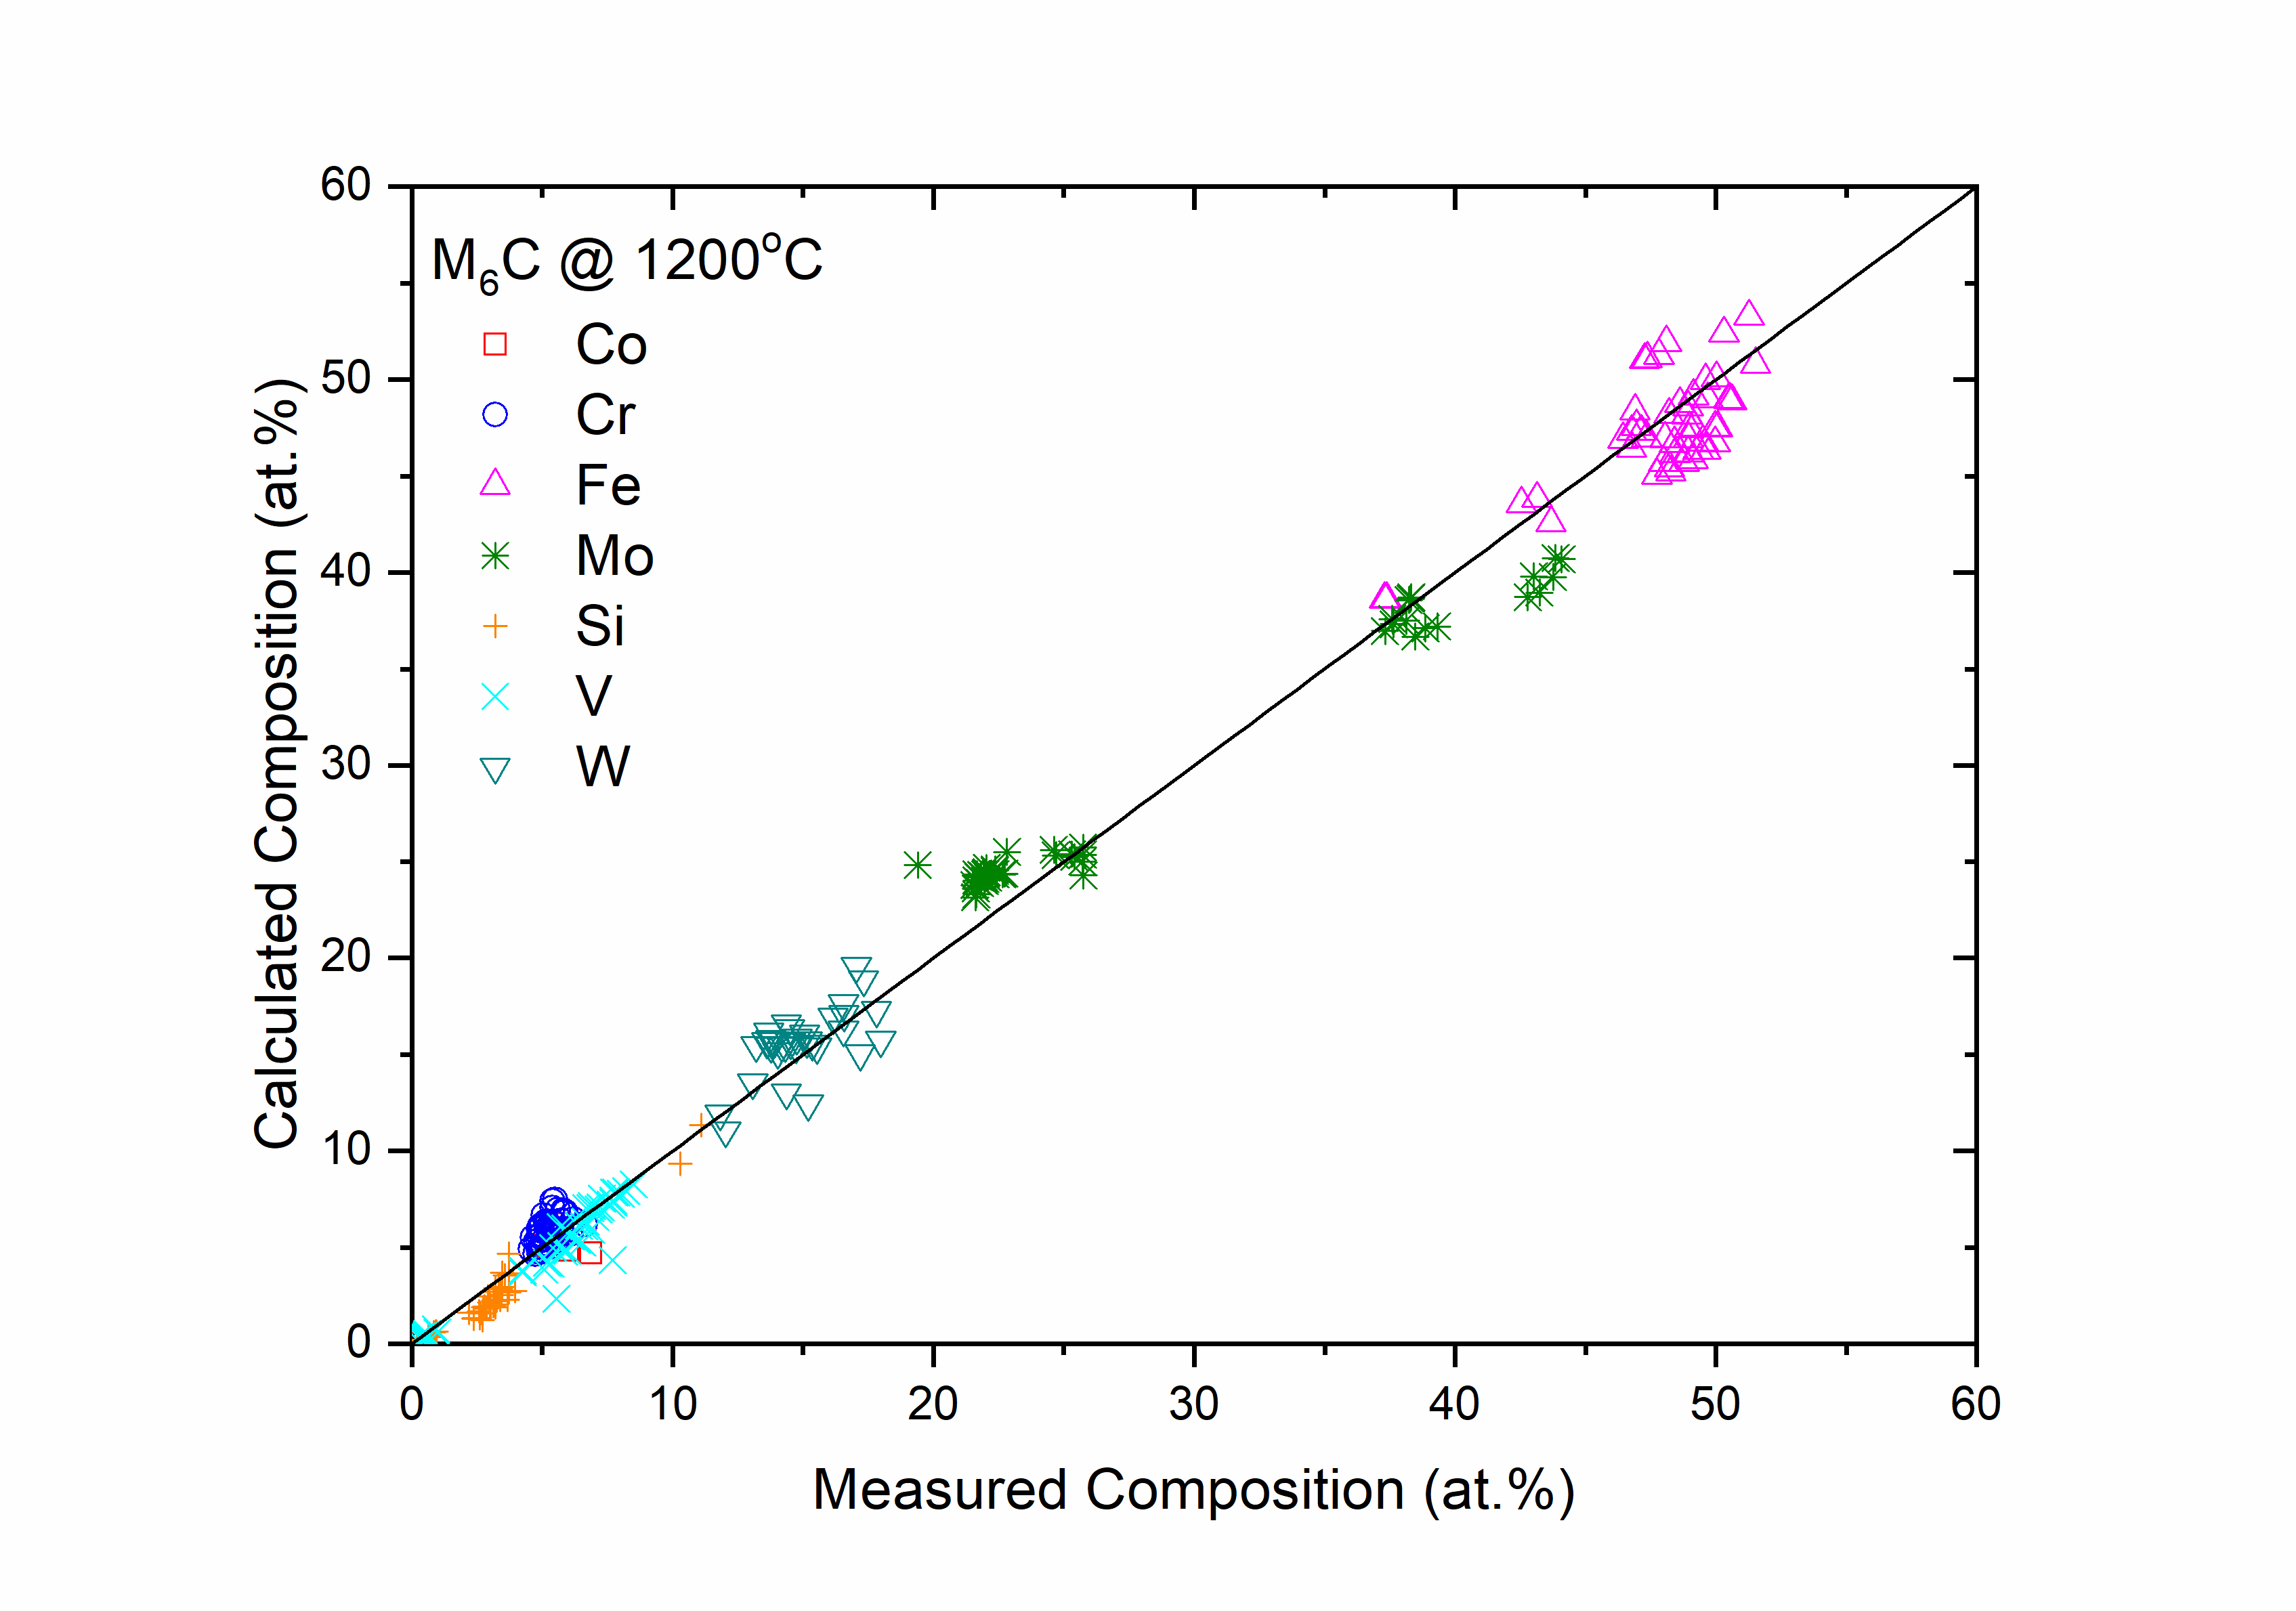
Figure 7: Comparison between the calculated and measured equilibrium compositions of Cr, Mo, Fe, V and W in the M6C phase at 1200 °C
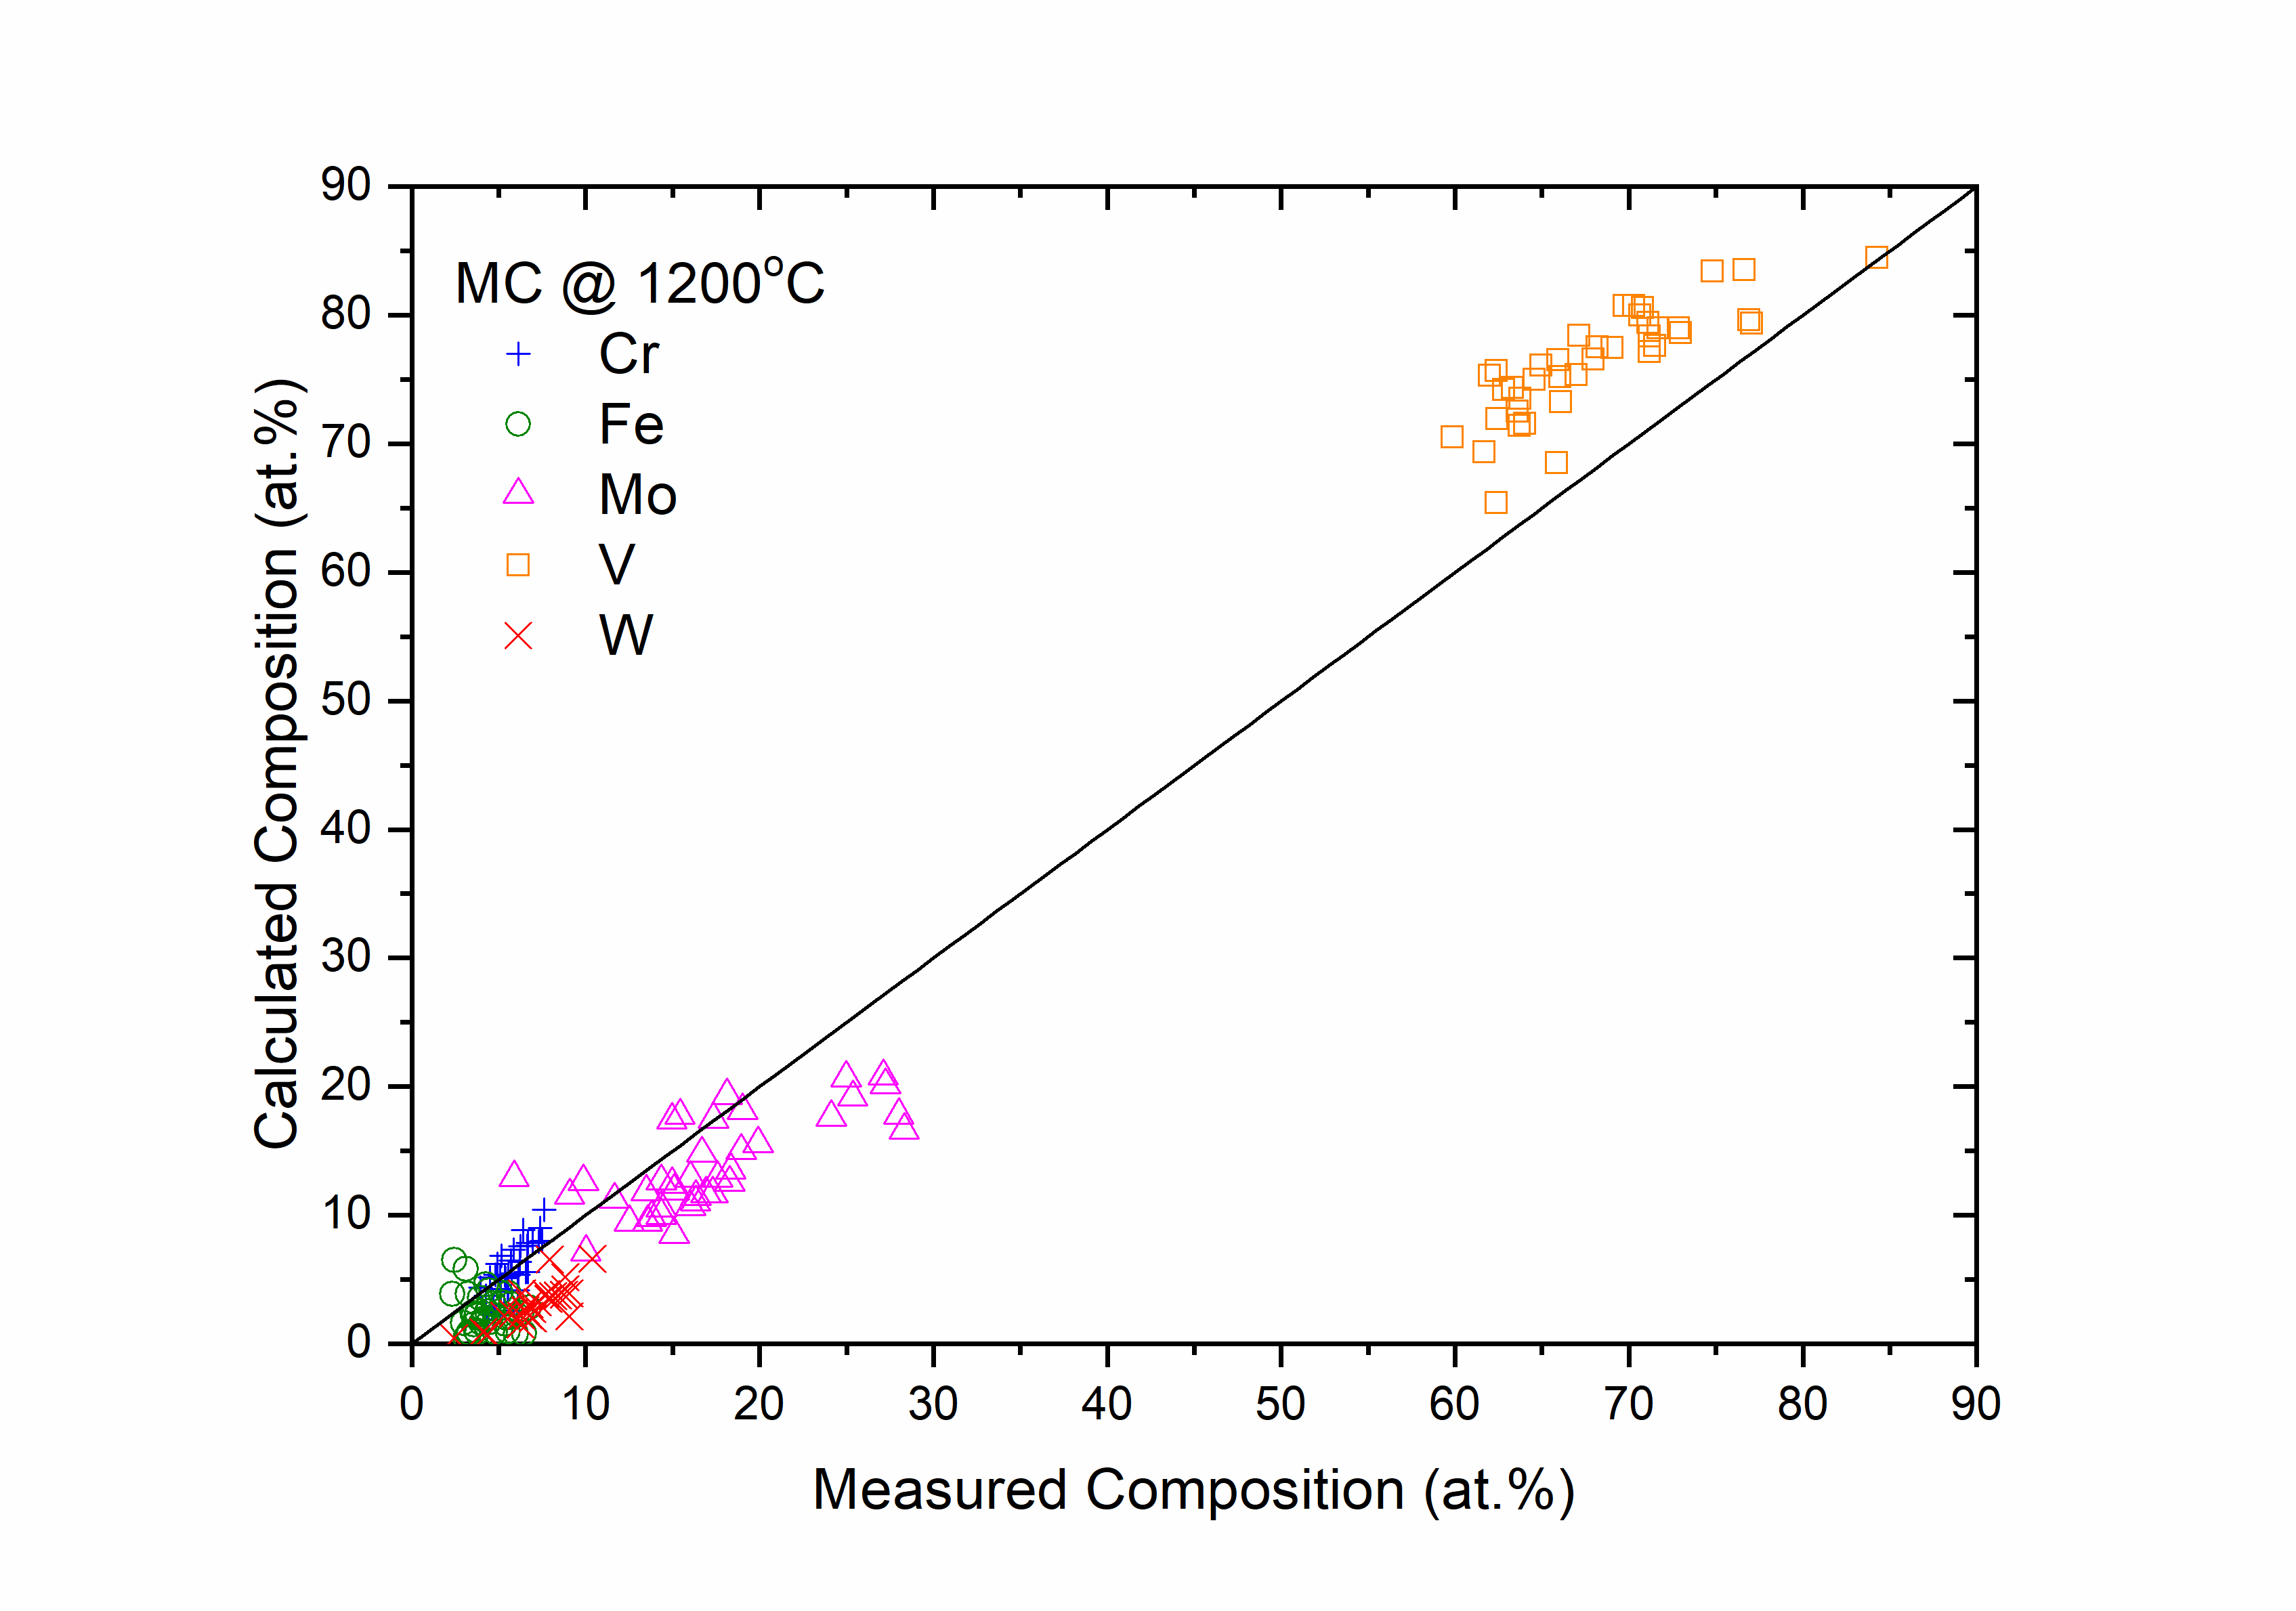
Figure 8: Comparison between the calculated and measured equilibrium compositions of Cr, Fe, Mo, V and W in the MC phase at 1200 °C
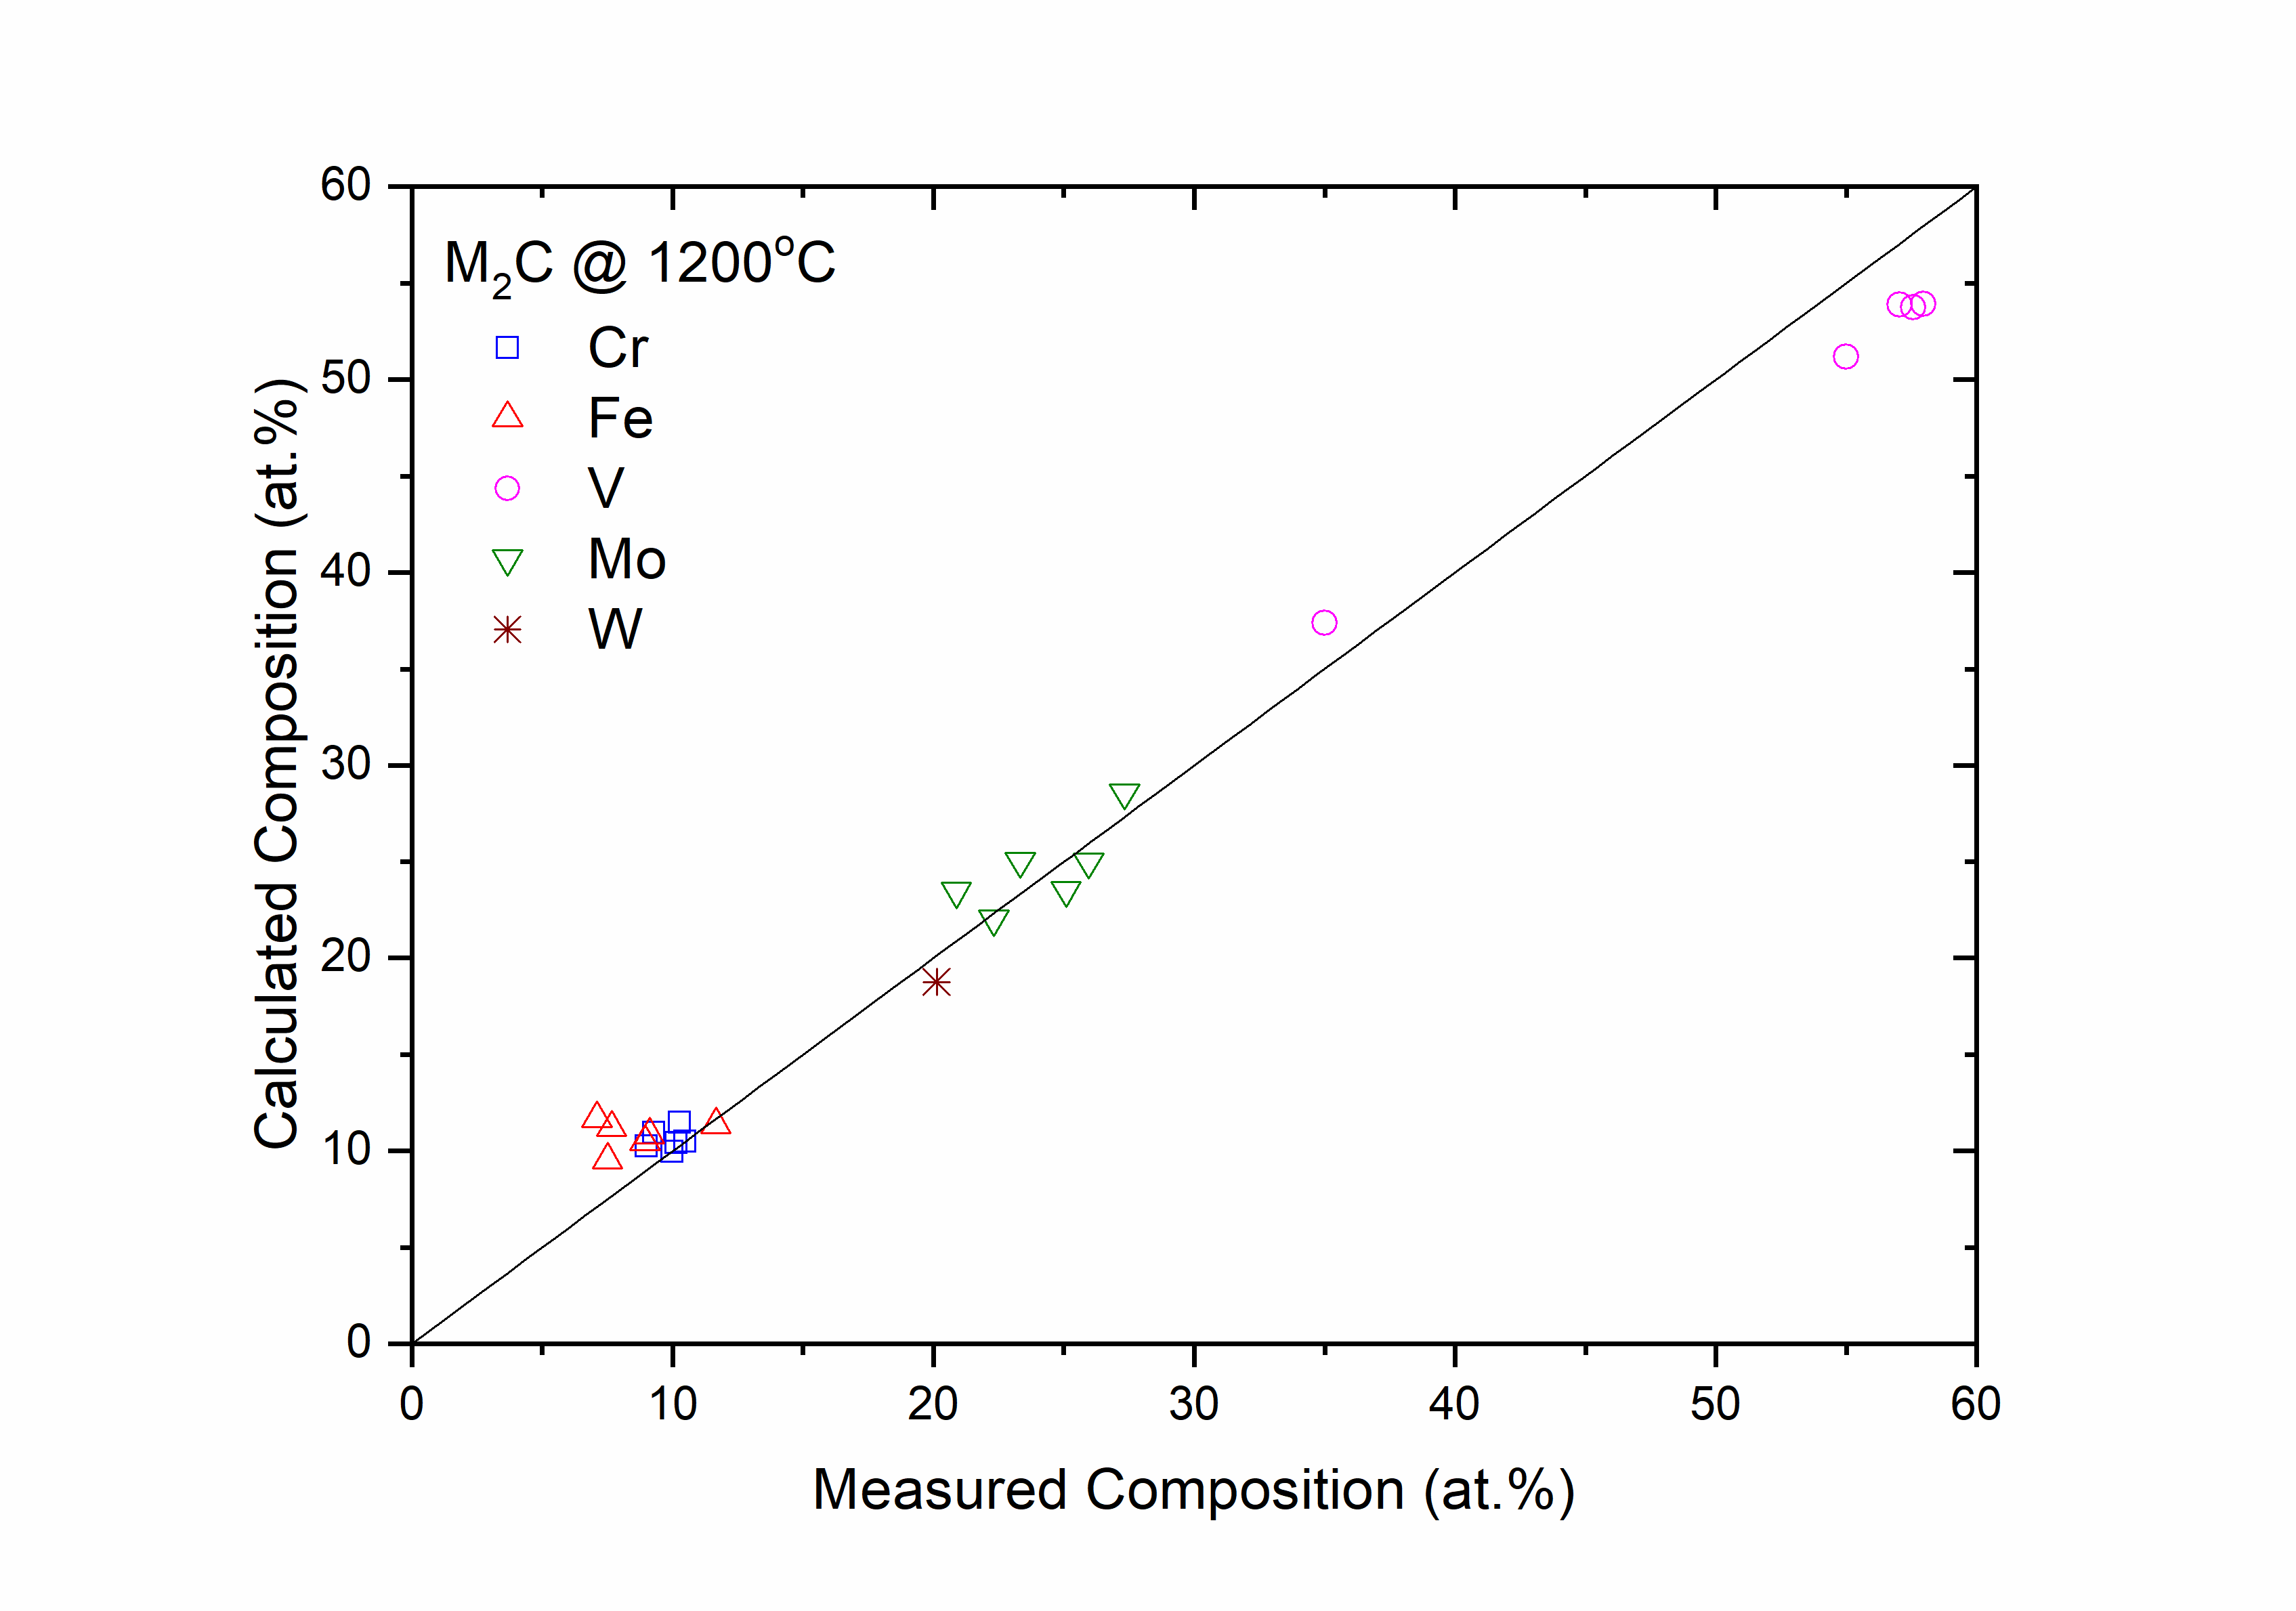
Figure 9: Comparison between the calculated and measured equilibrium compositions of Cr, Fe, Mo, V and W in the M2C (Hcp) phase at 1200 °C
[1977Jer] Jernkontoret, A Guide to the Solidification of Steels. Jernkontoret, Stockholm, 1977.
[1983Mae] Y. Maehara, Y. Ohmori, J. murayama, N. Fujino and T. Kunitake, Metal Science 17 (1983): 541-547.
[1984Tho] T. Thorvaldsson, H. Eriksson, J. Kutka and A. Salwen, in:Proceedings of the Conference for Stainless Steels, Goteborg, Sweden, 1984, pp. 101-105.
[1985Hay] F. H. Hayes, J. Less Common Metals 14 (1985): 89-96.
[1991Cor] M. B. Cortie and J. H. Potgieter, Met. Trans. 22A (1991): 2173-2179.
[1991Lon] R. D. Longbottom and F. H. Hayes, in:User Aspects of Phase Diagram, The Institute of Metals, London, 1991: 32-39.
[1991Wis] H. Wisell, Met. Trans. 22A (1991): 1391-1405.
[1994Nys] M. Nystrom and B. Karlsson, in Proceedings of the Conference for Duplex Stainless Steels’94, Welding Institute, Cambridge, 1994: 104.
[2000Mie] J. Miettinen and A.A. Howe, Ironmaking and Steelmaking, 2000 Vol. 27 No. 3, 212-227.
[2015Zhe] W. Zheng, et al., Thermodynamic assessment of the Fe-Mn-Si system and atomic mobility of its fcc phase. Journal of Alloys and Compounds, 632 (2015): 661-675.
[2021Ber] M. Bernhard, P. Presoly, C. Bernhard, S. Hahn and S. Ilie, Metall. Mater. Trans. B, 52 (2021) 2821-2830.